


- By Indication
 Inflammatory and Autoimmune DiseasesRespiratory DiseasesInfectious DiseasesRare DiseaseGut Microbiota Research ServiceBy Modality
 Preclinical Model Strategies for T-Cell Engagers: From Oncology to Autoimmune Disease
 2026-10-27
 11:00 AM ET
 Dr. Wanjun Yuan & Dr. Haiqiao SunOne TCE Modality. Two Disease Contexts. Different Preclinical Questions.
'/%3e%3c/svg%3e)

Myasthenia Gravis (MG)

- 50+HF Models
- 200+Studies Completed
- 15+ND-Enabling Studies
Our Advantages
Industry-leading capabilities for Myasthenia Gravis research

Murine and Human Immune-Based Models
We offer two models that capture distinct facets of MG pathology. The peptide-induced model recapitulates antigen-driven murine autoimmunity (Th1/Th17/B cell activation) and key MG phenotypes. The patient PBL-derived model harbors human pathogenic immune cells, capturing clinical human MG signatures unavailable in murine-only systems.
01
Validated Across Multiple Therapeutic Modalities
Our models support evaluation of diverse therapeutic modalities, including small molecules (e.g., fenebrutinib), therapeutic antibodies, T-cell engagers (TCEs), and cell therapies (e.g., CAR-T).
02
Model Library
Comprehensive Myasthenia Gravis models for preclinical research

Case Studies & Validation Data
Explore our validated Myasthenia Gravis studies demonstrating the efficacy of various therapeutic interventions.
AchR97-116 induced Experimental Autoimmune Myasthenia Gravis (MG)
The MG model construction and evaluation using female B6 mice.

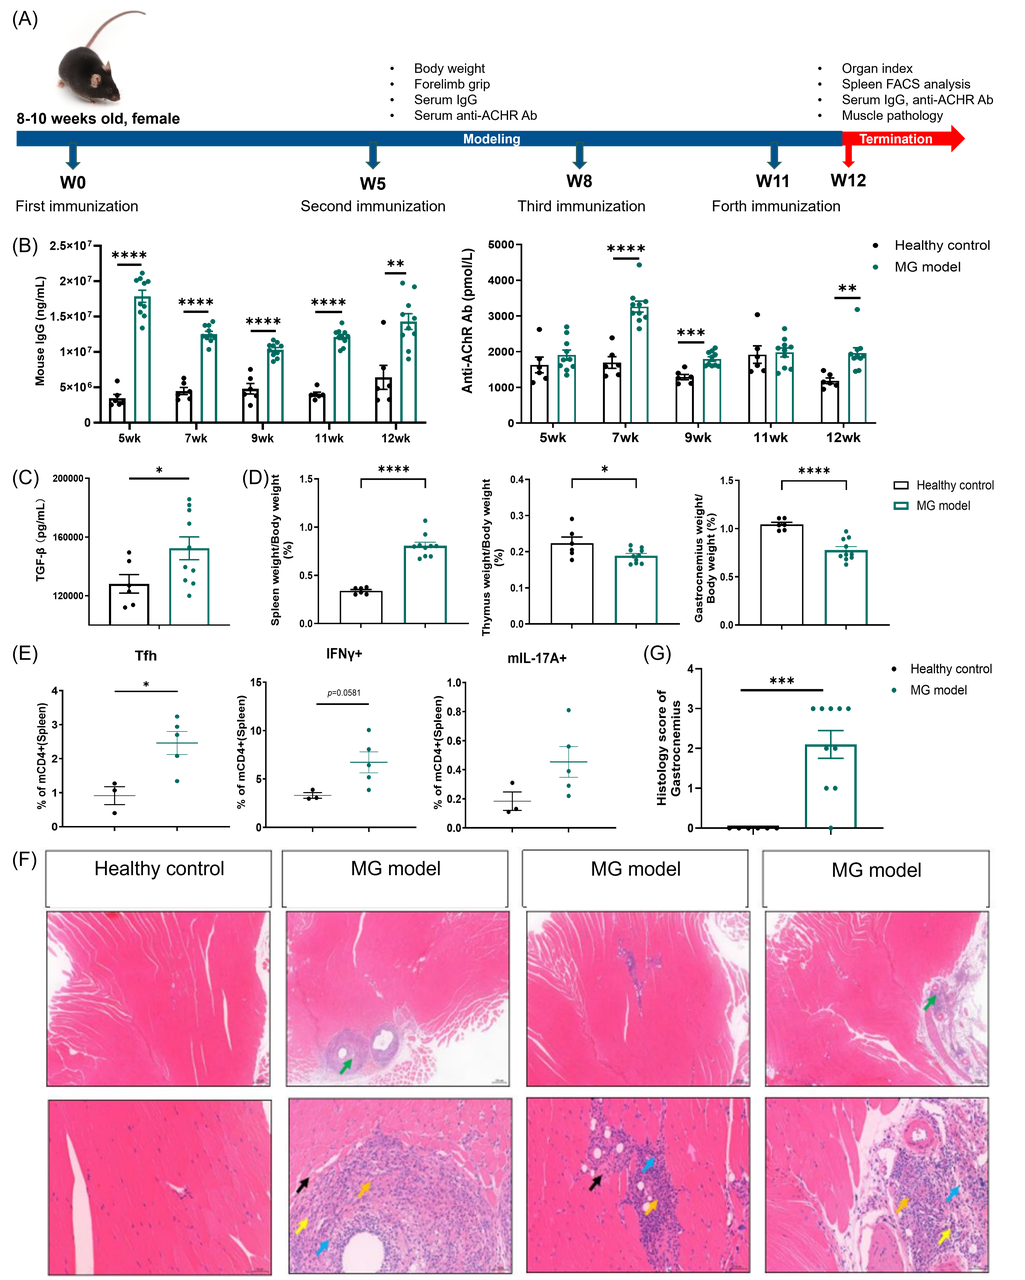
Panel A Study design. Female B6 mice aged 8-10 weeks were immunized with ACHRα 97-116 peptide on weeks 0, 5, 8, and 11. Mice were sacrificed 12 weeks after the first immunization.
Panel B MG modeling significantly elevated serum IgG and anti‑AChR antibody levels compared with healthy controls throughout the modeling phase.
Panel C MG modeling led to a significant elevation in serum TGF‑β levels relative to healthy controls at the study endpoint.
Panel D MG modeling significantly increased the spleen‑to‑body weight ratio compared with healthy controls at endpoint. MG modeling significantly decreased the thymus‑to‑body weight ratio and gastrocnemius‑to‑body weight ratio compared with healthy controls at endpoint.
Panel E Significant increase in spleen Tfh cells was observed in MG mice relative to healthy mice. An increasing trend in spleen Th1(IFNγ+) and Th17(IL17A+) cells was observed in MG mice relative to healthy mice.
Panel F The representative images of H&E staining slides using gastrocnemius tissues. Notes: Muscle fiber degeneration and necrosis (black arrow) loose connective tissue inflammatory cell infiltration and fibrous tissue hyperplasia around muscle tissue (green arrow) lymphocytes (blue arrow) neutrophils (yellow arrow) fibrous tissue hyperplasia (orange arrow). The first row: bar = 200 μm; Second row: bar = 50 μm.
Panel G Significant increase in gastrocnemius histology score was observed in MG mice relative to healthy mice.
Data is expressed as mean ± standard error (Mean ± SEM). Statistics performed using One-way ANOVA. *P < 0.05; **P < 0.01; ***P < 0.001; ****P < 0.0001.
Title: Efficacy study of Fenebrutinib in the AchR97-116 induced MG model using female B6 mice.
Efficacy study of Fenebrutinib in the AchR97-116 induced MG model using female B6 mice.
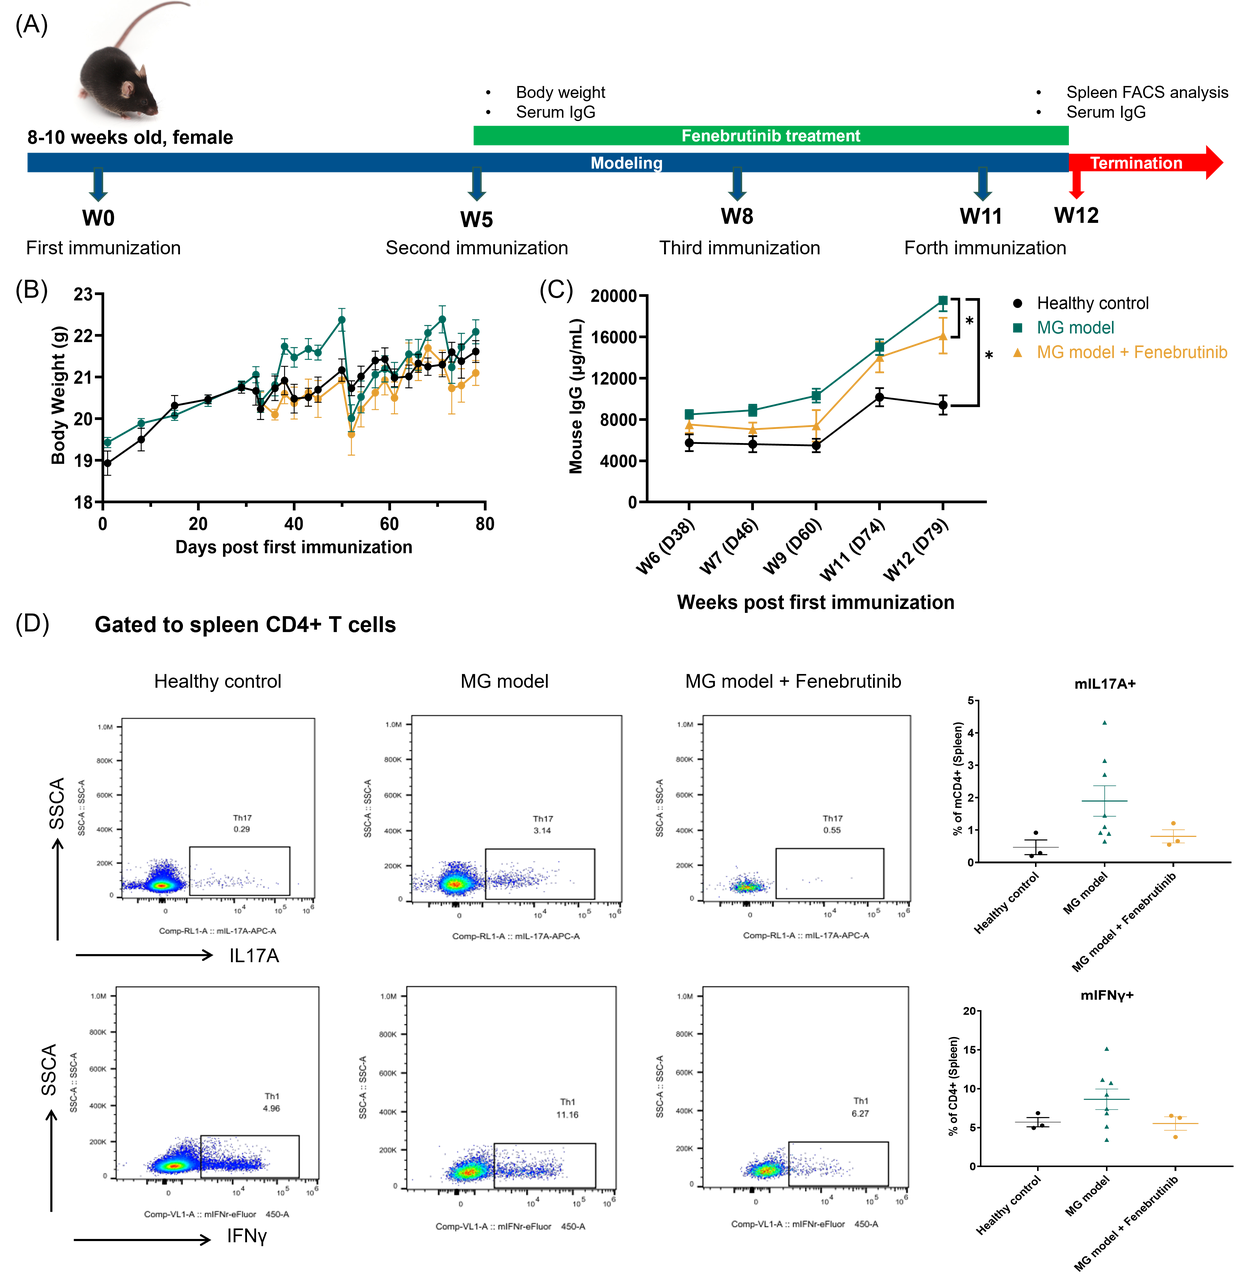
Panel A Study design. Female B6 mice aged 8-10 weeks were immunized with ACHRα 97-116 peptide on weeks 0, 5, 8, and 11. Fenebrutinib administration was initiated on week 5. Mice were sacrificed 12 weeks after the first immunization.
Panel B Fenebrutinib administration showed no significant difference in body weight compared to MG model group.
Panel C Fenebritinib administration significantly inhibited mouse IgG levels compared to the MG model group.
Panel D Representative FACS plots and quantification of splenic T‑cell subsets. A downward trend in Th1 (IFN‑γ⁺) and Th17 (IL‑17A⁺) cell percentages was observed in Fenebrutinib‑treated mice compared with the MG model group.
Data is expressed as mean ± standard error (Mean ± SEM). Statistics performed using One-way ANOVA. *P < 0.05; **P < 0.01; ***P < 0.001; ****P < 0.0001.

MG patient-derived PBLs in NCG Mice
The phenotype of MG patient-derived PBLs induced MG model
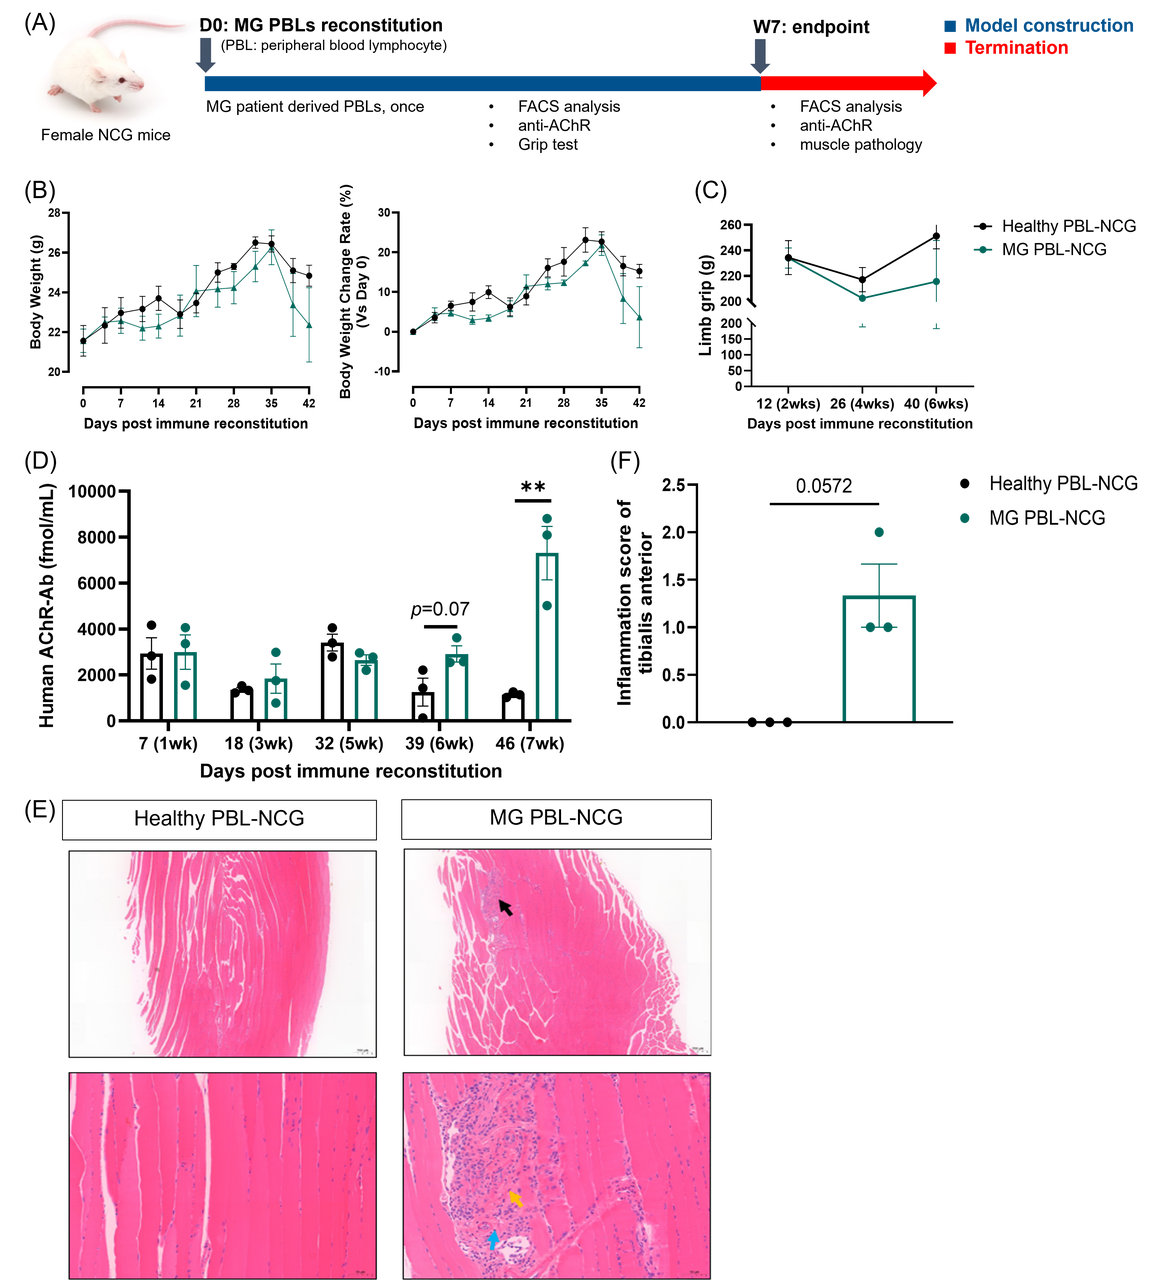
Panel A Study design. Female NCG mice were reconsitituted with healthy human PBLs or MG patient-derived PBLs on Day 0. Mice were sacrificed 7 weeks (Day 42) after PBL reconstitution.
Panel B No significant differences were observed in body weight or its change between healthy PBL‑NCG and MG PBL‑NCG mice.
Panel C A downward trend in grip strength was observed in MG PBL‑NCG mice relative to healthy PBL‑NCG mice.
Panel D MG PBL reconstitution significantly increased human AChR antibody levels compared to healthy PBL‑NCG mice.
Panel E Representative images of H&E stained slides of tibialis anterior tissues. Notes: muscle fiber degeneration and necrosis, atrophy (black arrow); lymphocytes (blue arrow); fibrous tissue hyperplasia (orange arrow). First row: Bar=100 um; Second row: Bar=20 um.
Panel F Increasing trend in the tibialis anterior inflammation score was observed in MG PBL‑NCG mice relative to healthy PBL‑NCG mice.
Data is expressed as mean ± standard error (Mean ± SEM), n=3. Statistics performed using One-way ANOVA. *P < 0.05; **P < 0.01; ***P < 0.001; ****P < 0.0001.
All Product Lines
Browse our comprehensive catalog of over 30,000 mouse models covering various gene families, signaling pathways, and disease models. Use advanced filters to find the perfect model for your research.


- 1
- 2
- 3
- 4
- 5
- 6
- 42
Recommended for You
Discover related models and services to accelerate your Myasthenia Gravis research

Ready to Start Your Custom Model Project?
Download



Newsletter Signup


We value your privacy
This website will store cookies on your computer. These cookies are used to collect information about how you interact with this website and enable us to remember you. We use this information to improve and customize your browsing experience, as well as to analyze and collect relevant data and metrics about visitors on this website and other platforms. For more information about the cookies we use, please refer to our privacy policy
If you decline, your information will not be tracked when visiting this website. A cookie will be used in your browser to remember your preference settings that you have not accepted.


Contact Us
Schedule a Meeting
Let us know which event you're attending and we'd be happy to connect with you.