


- By Indication
 Inflammatory and Autoimmune DiseasesRespiratory DiseasesInfectious DiseasesRare DiseaseGut Microbiota Research ServiceBy Modality
 Preclinical Model Strategies for T-Cell Engagers: From Oncology to Autoimmune Disease
 2026-10-27
 11:00 AM ET
 Dr. Wanjun Yuan & Dr. Haiqiao SunOne TCE Modality. Two Disease Contexts. Different Preclinical Questions.
'/%3e%3c/svg%3e)

Heart Failure with Preserved Ejection Fraction (HFpEF)

- 7+Validated Models
- 30+Studies Completed
- 7IND-Enabling Studies
Our Advantages
Industry-leading capabilities for heart failure research

Standardized Doppler & PV-loop technique for diastolic function analysis.
Expertise in assessing diastolic dysfunction using standardized Doppler echocardiography (Pulsed-Wave + Tissue Doppler Imaging) and pressure-volume (PV) loop analysis for comprehensive hemodynamic profiling in HFpEF models.
01
Drug efficacy & IND-enabling studies.
Extensive experience in mature preclinical models and IND-enabling drug efficacy studies.
02
First-in-class HFpEF spontaneous model in market for speeding up efficacy studies.
Proprietary first-in-class spontaneous HFpEF model accelerating therapeutic efficacy evaluation.
03
Model Library
*Model has been used in IND-enabling studies

Case Studies & Validation Data
Explore our validated heart failure studies demonstrating the efficacy of various therapeutic interventions.
HFD+ANGII
Ang II dosed dependent HFpEF with HFD

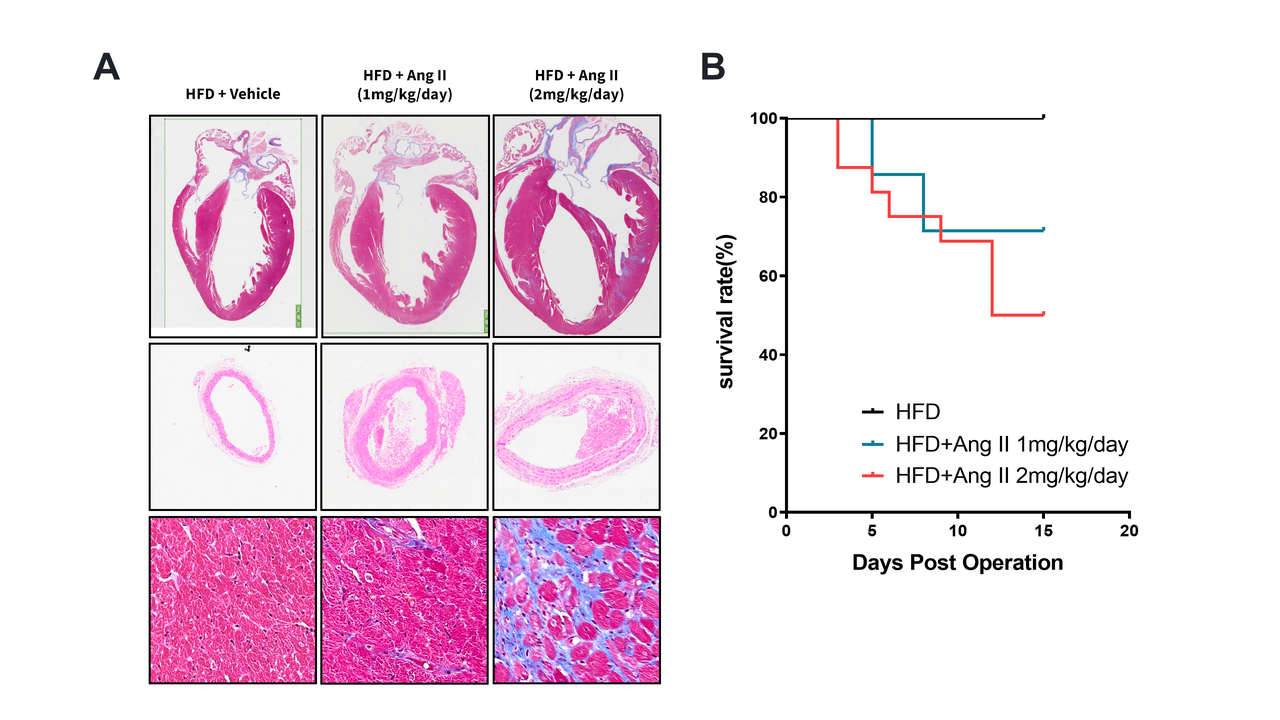
(A) Heart histology: HFD+Ang II groups show dose-dependent remodeling vs. HFD+Vehicle, including cardiac hypertrophy, coronary artery alteration, and interstitial fibrosis. (B) Survival curve: Both Ang II groups show dose-dependent mortality.
HFD+Ang II induces diastolic dysfunction.
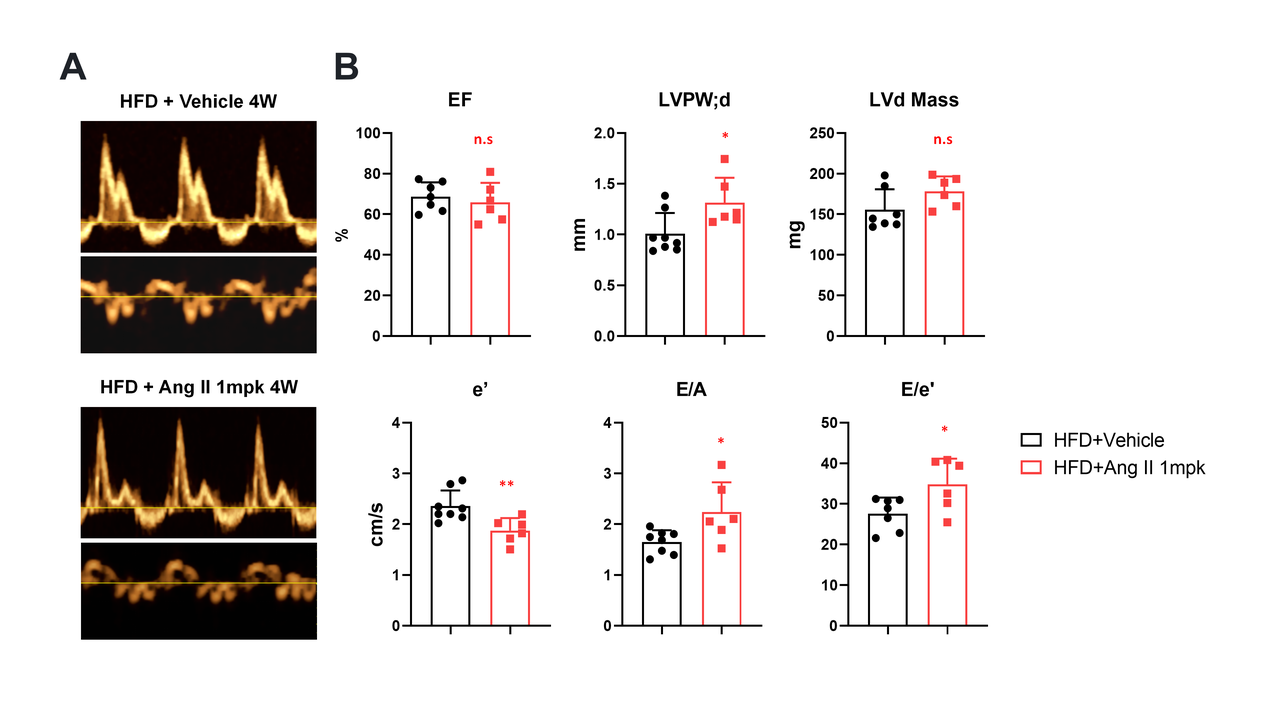
(A) Representative M-mode images comparing HFD+Vehicle vs. HFD+Ang II (1 mpk) at 4 weeks. (B) Echo data shows Ang II causes concentric hypertrophy (↑LVPW;d, ↑LVd Mass) with preserved EF, and impaired diastolic function (↓e', ↑E/e' ratio).

HFD+L-NAME
HFD+L-NAME induces cardiac remodeling and diastolic dysfunction.
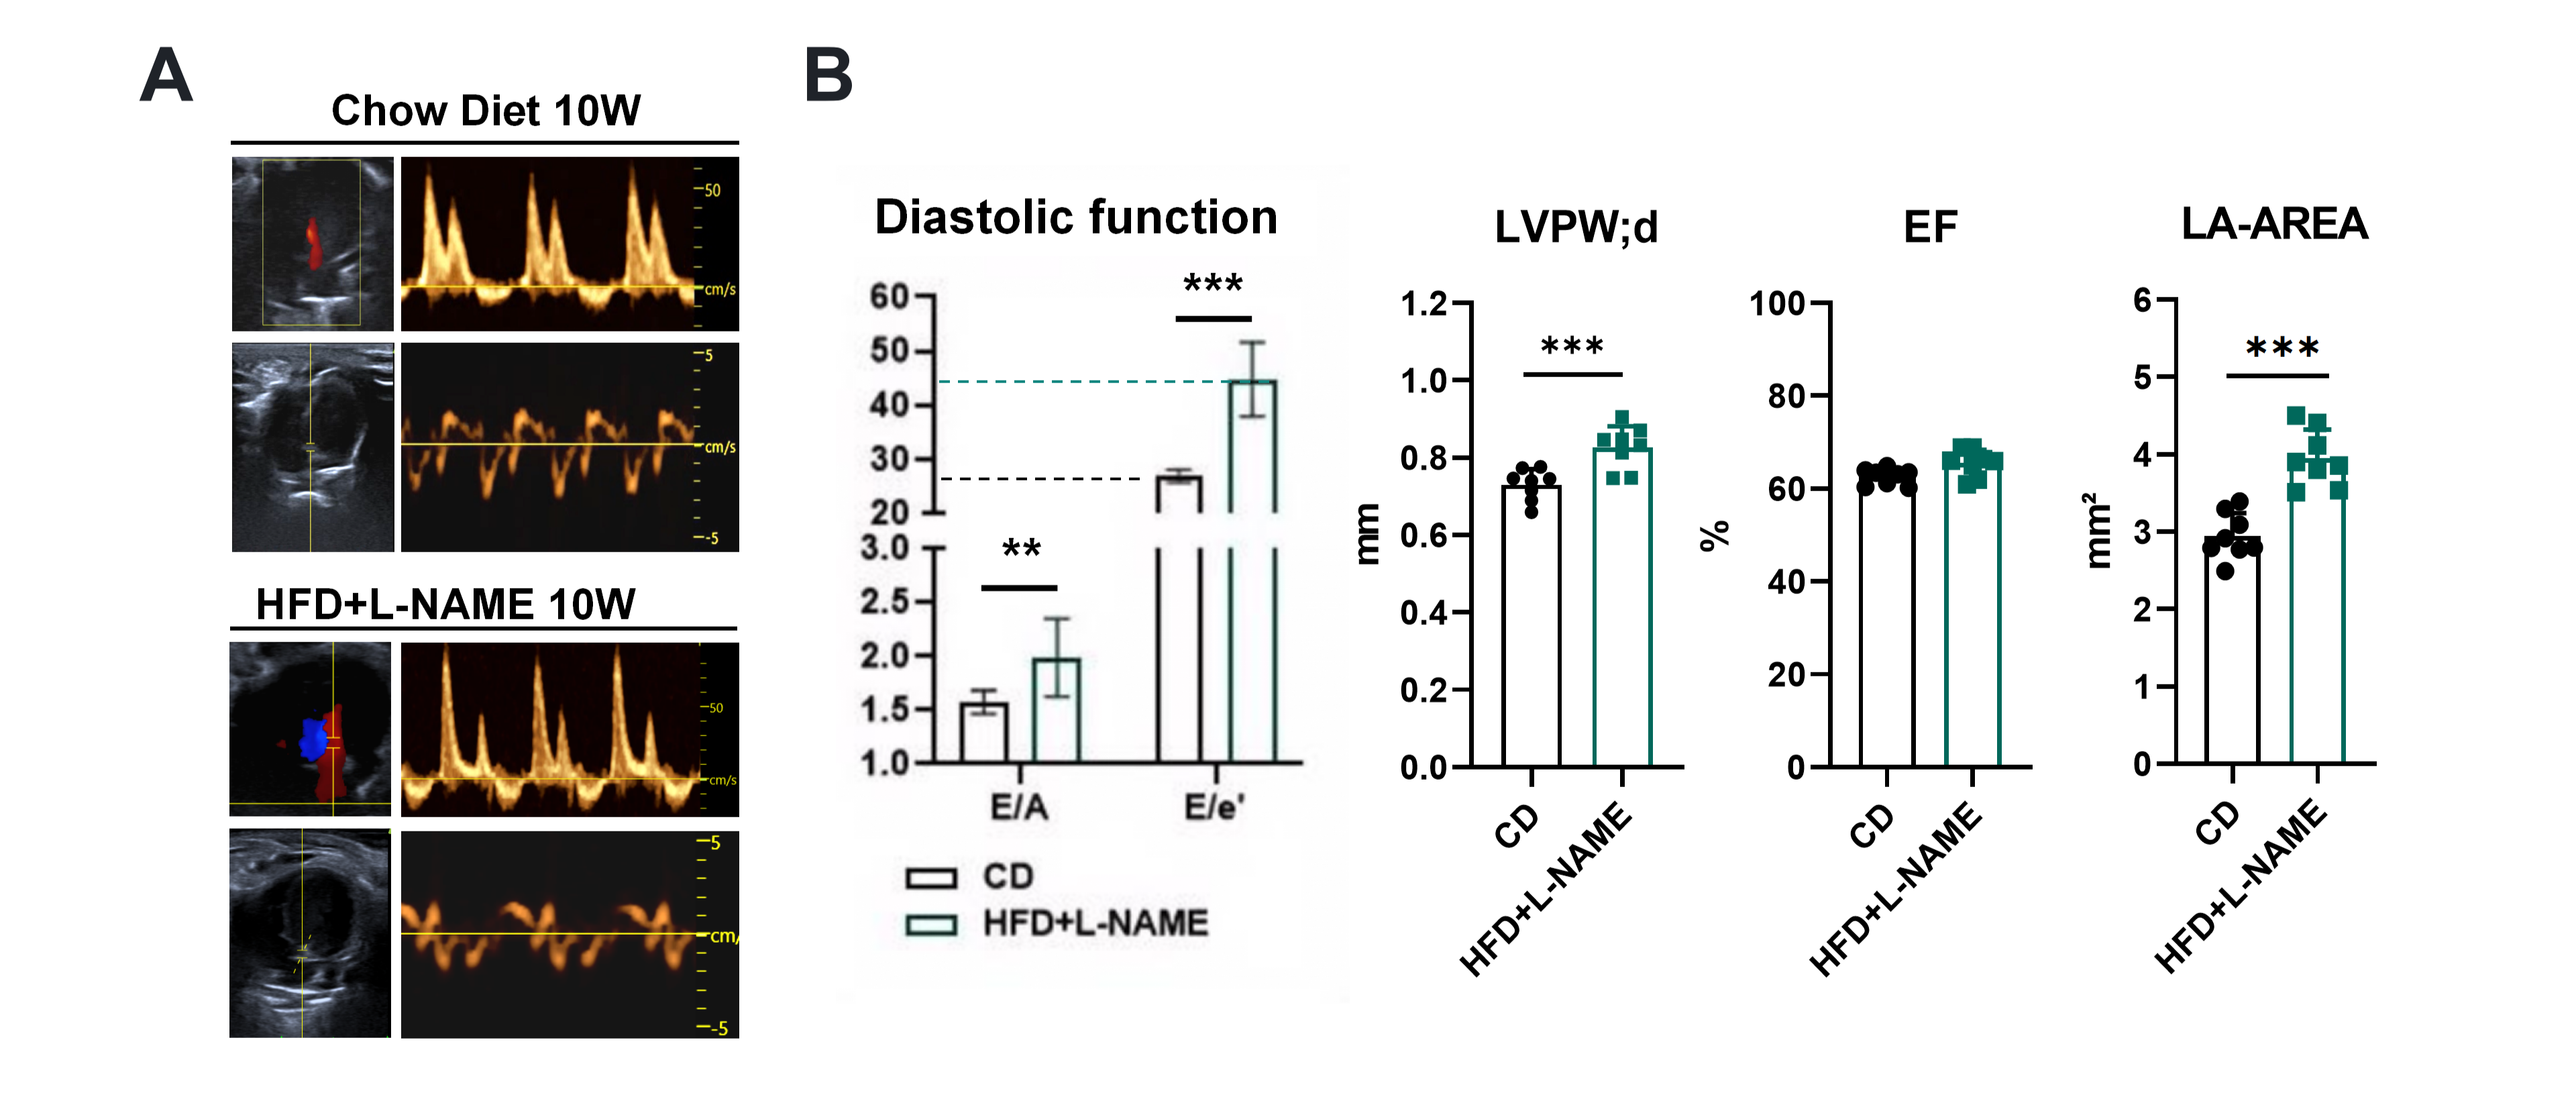
(A) Representative B-mode/Doppler images. (B) Compared to Chow Diet, HFD+L-NAME mice show impaired diastolic function (altered E/A, ↑E/e'), increased LVPW;d, preserved EF, and larger LA area*. Data: mean±SEM; *p<0.05, p<0.01,*p<0.001.
Systemic and cardiac effects of HFD+L-NAME.
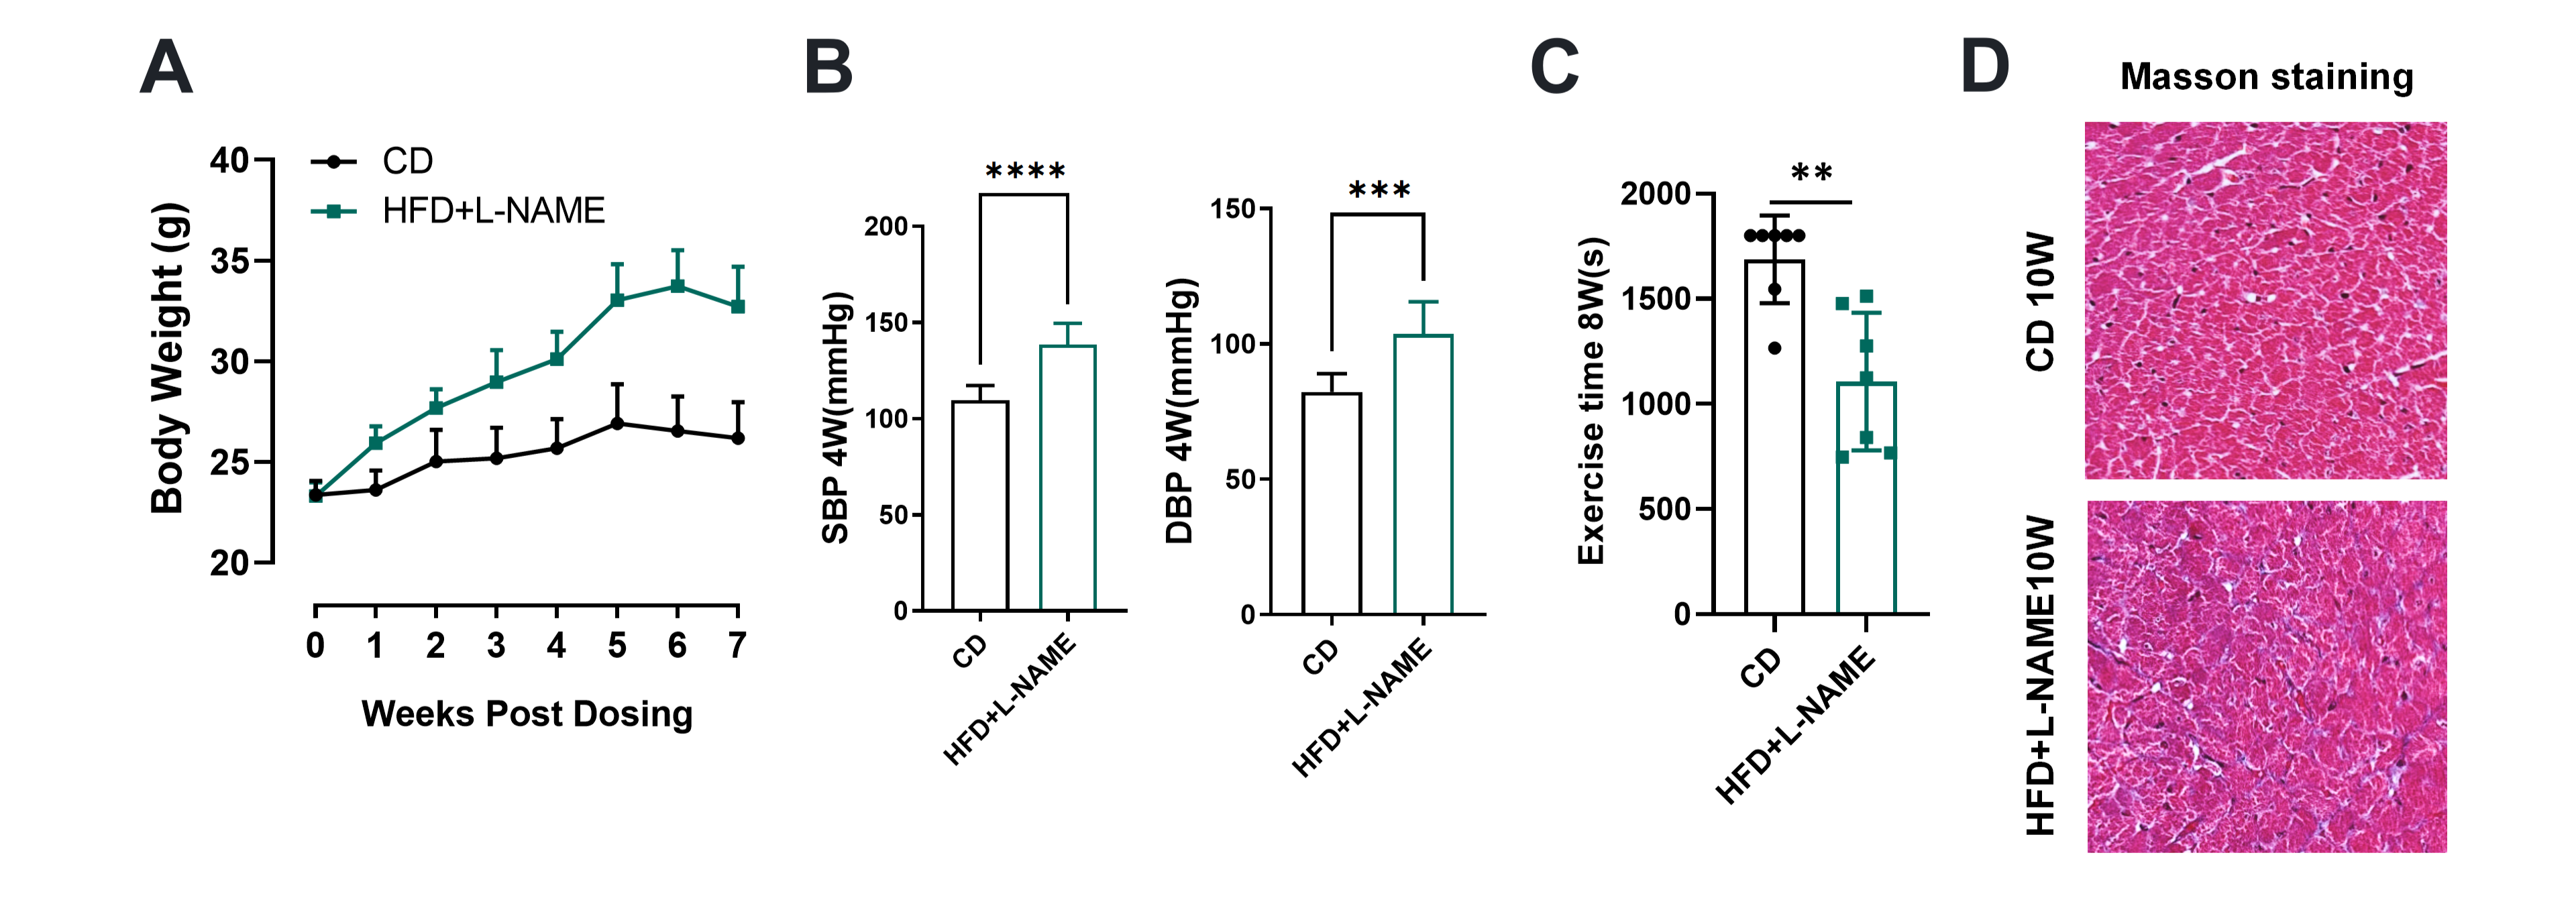
(A) Body weight increased progressively vs. control. (B) SBP and DBP were significantly elevated. (C) Exercise tolerance time was reduced (*). (D) Masson's trichrome staining shows interstitial fibrosis vs. in control.
Drug treatment in an HFD+L-NAME model.
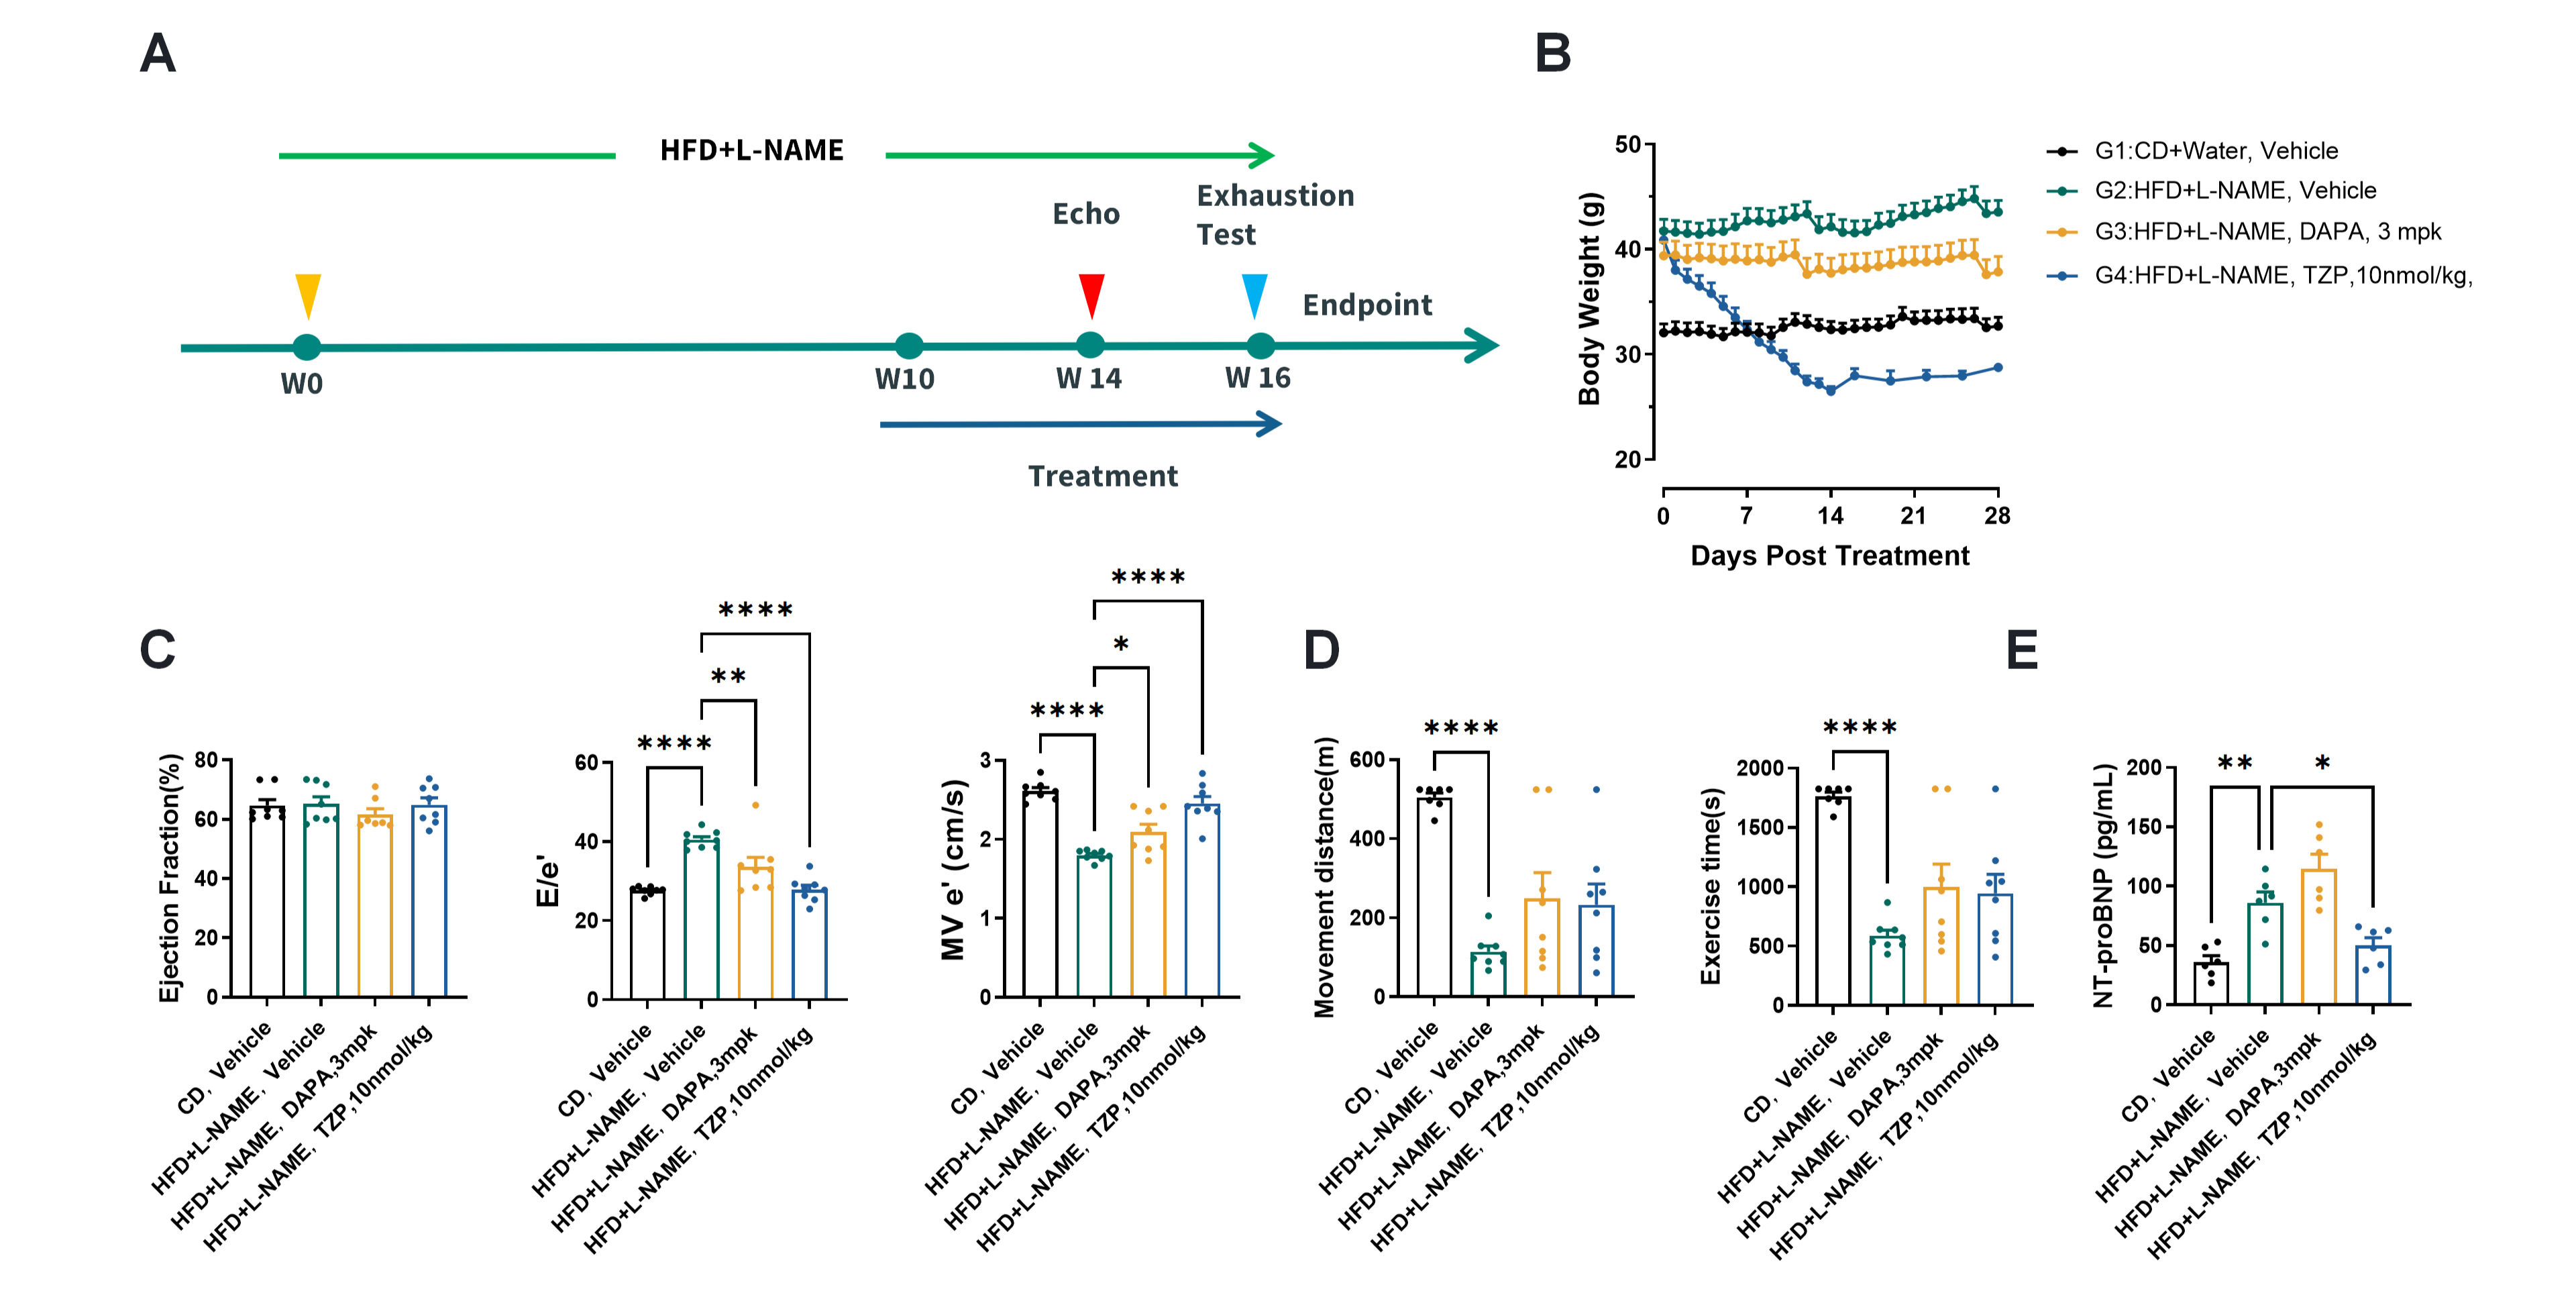
(A) 16-week study design. (B) Body weight during 28-day treatment for four groups. (C-E) At endpoint, disease model (G2) shows diastolic dysfunction (↑E/e', ↓e'), reduced exercise capacity, and ↑NT-proBNP vs. lean control (G1). Treatments (G3: DAPA, G4: TZP) improve these parameters (*p<0.05, p<0.01,*p<0.001).
SHM
SHM spontaneously develops obesity and hypertension
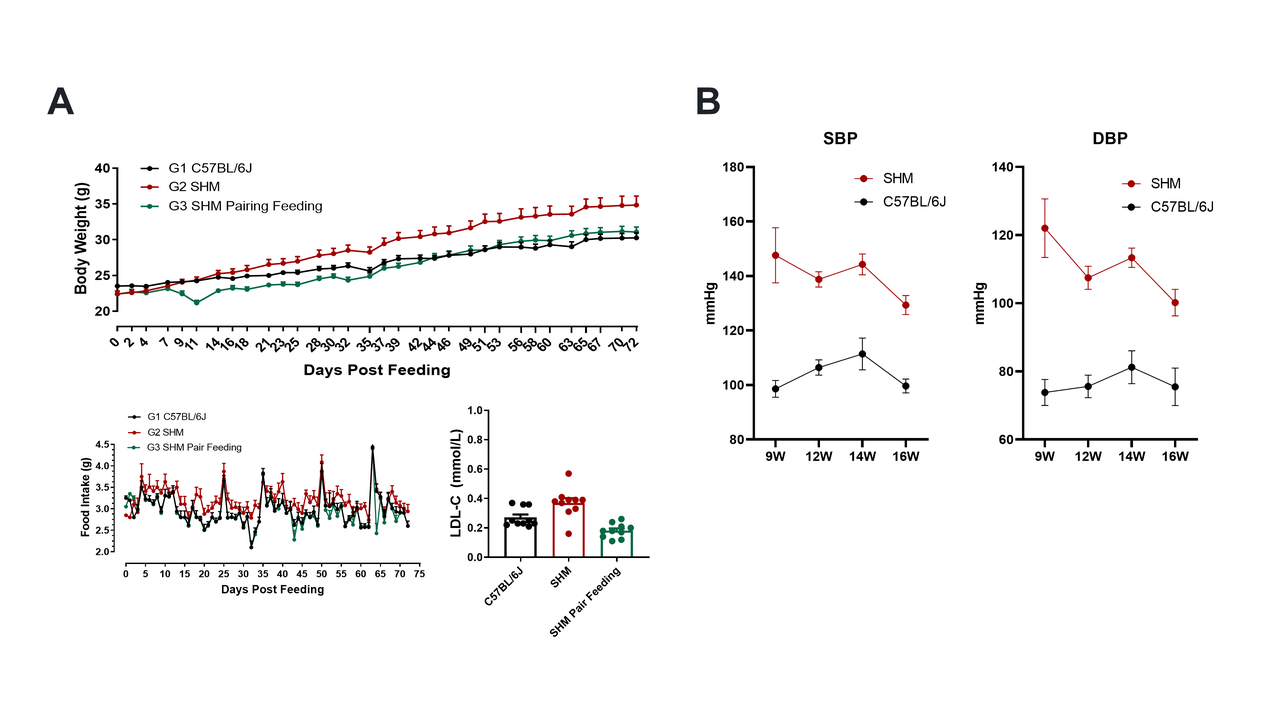
(A) Body weight, Food intake and LDL-C: SHM. (B) SHM group shows consistently and significantly elevated systolic (SBP) and diastolic (DBP) blood pressure vs. control from weeks 9-16.
Echocardiographic features of SHM model.
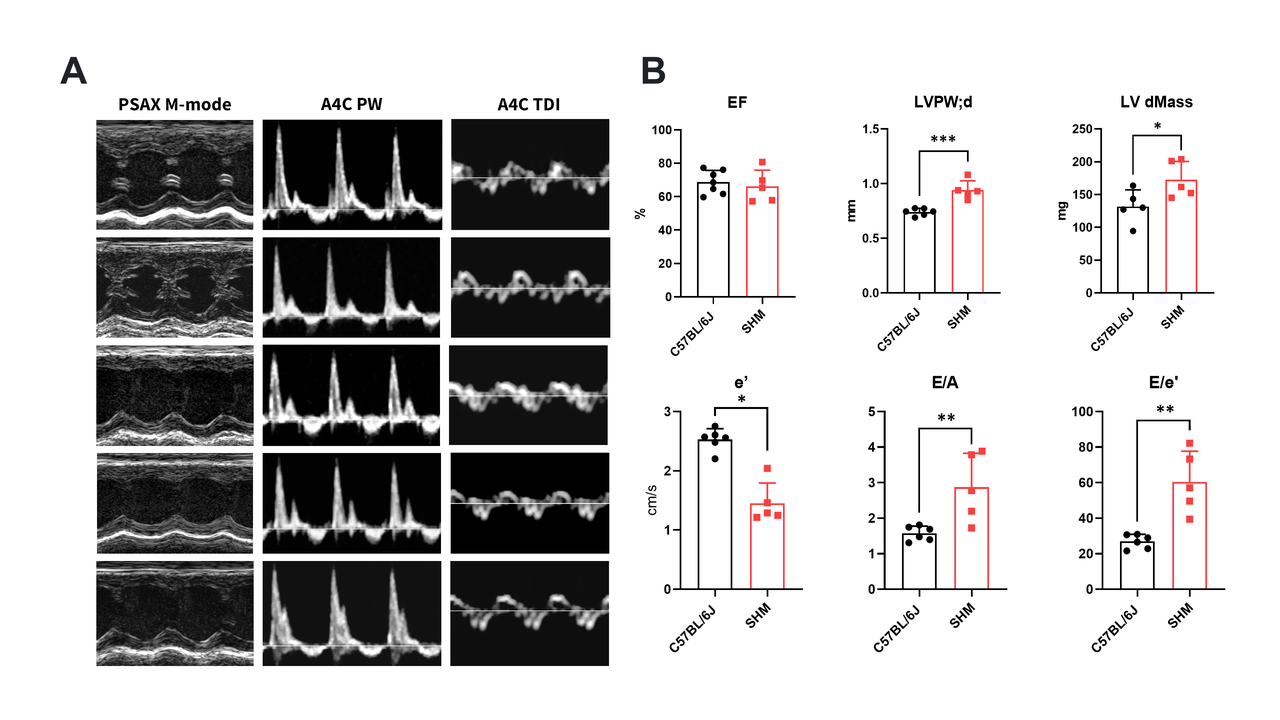
(A) Representative PSAX M-mode, PW Doppler, and TDI images. (B) Quantitative analysis shows SHM mice vs. C57BL/6J controls have preserved EF, increased LVPW;d and LVd Mass (hypertrophy), and impaired diastolic function (↓e', ↑E/e'*). Data: mean±SEM; *p<0.05.
DAPA and TZP treatment in SHM model.
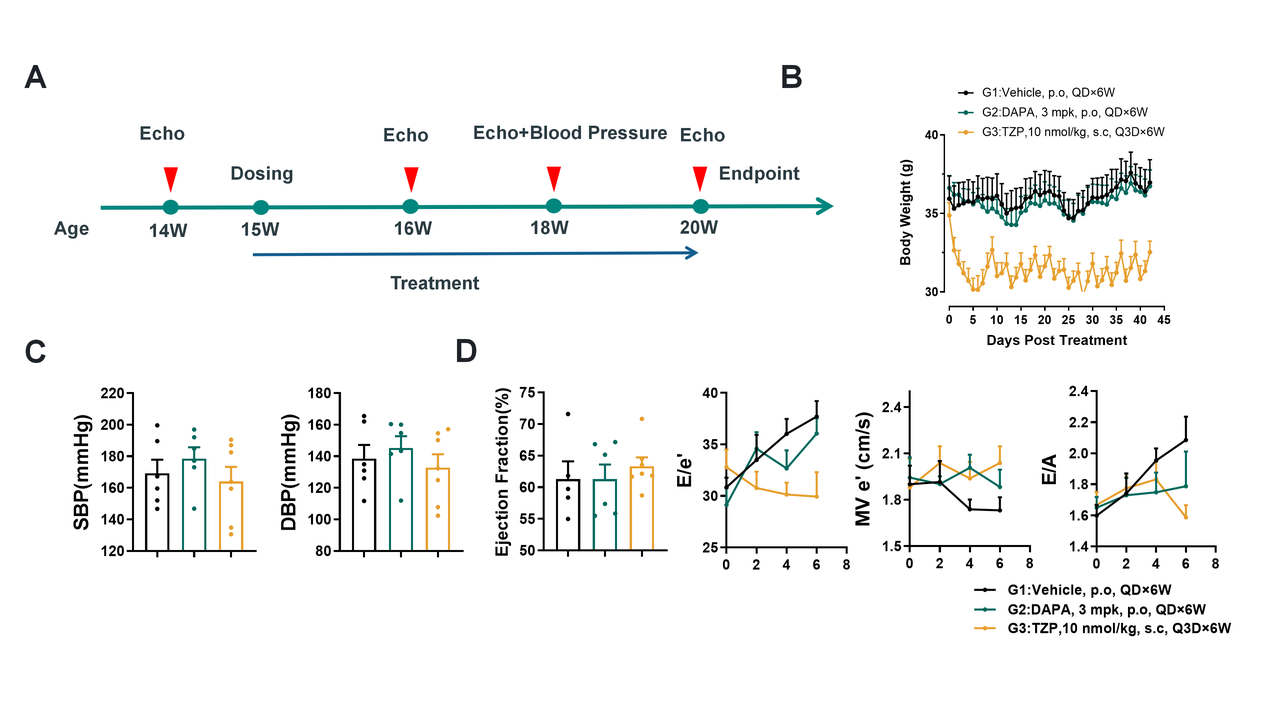
(A) Timeline: Treatment from weeks 15-20. (B) Body weight change. (C) Endpoint blood pressure. (D) Serial echocardiography for EF, E/e', MV e', and E/A. Groups: G1 (Vehicle), G2 (DAPA 3 mpk), G3 (TZP 10 nmol/kg). Data: mean±SEM.
All Product Lines
Browse our comprehensive catalog of over 30,000 mouse models covering various gene families, signaling pathways, and disease models. Use advanced filters to find the perfect model for your research.


- 1
- 2
- 3
- 4
- 5
- 6
- 9
Recommended for You
Discover related models and services to accelerate your research

Accelerate Your Research
Download



Newsletter Signup


We value your privacy
This website will store cookies on your computer. These cookies are used to collect information about how you interact with this website and enable us to remember you. We use this information to improve and customize your browsing experience, as well as to analyze and collect relevant data and metrics about visitors on this website and other platforms. For more information about the cookies we use, please refer to our privacy policy
If you decline, your information will not be tracked when visiting this website. A cookie will be used in your browser to remember your preference settings that you have not accepted.


Contact Us
Schedule a Meeting
Let us know which event you're attending and we'd be happy to connect with you.