


- By Indication
 Inflammatory and Autoimmune DiseasesRespiratory DiseasesInfectious DiseasesRare DiseaseGut Microbiota Research ServiceBy Modality
 Preclinical Model Strategies for T-Cell Engagers: From Oncology to Autoimmune Disease
 2026-10-27
 11:00 AM ET
 Dr. Wanjun Yuan & Dr. Haiqiao SunOne TCE Modality. Two Disease Contexts. Different Preclinical Questions.
'/%3e%3c/svg%3e)

Diabetic Nephropathy

- 5+Integrated Diabetes Nephropathy Platforms
- 20+Metabolic & Renal Biomarkers
- 10+Validated Therapeutic Reference Drug Benchmarks
Our Advantages
Industry-leading capabilities for diabetic nephropathy

Diverse and Advanced Diabetic Kidney Disease (DKD) Models
Models encompass spontaneous genetic mutations (e.g., db/db, Nos3-/-), viral induction (AAV-mRenin), and surgical combinations (UNx), accurately reflecting human progressive structural and functional renal damage
01
Comprehensive Renal Function and Pathology Assessment
Multi-dimensional evaluation combining systemic metabolic monitoring with specific renal readouts (such as UACR) and advanced histopathology (PAS and Masson staining) for glomerulosclerosis and interstitial fibrosis
02
Robust Efficacy Evaluation Platform
Validated therapeutic platforms utilizing standard-of-care reference drugs (e.g., multi-receptor agonists, SGLT2 inhibitors) to support the precise translational evaluation of novel renoprotective drug candidates
03
Model Library

Case Studies & Validation Data
Explore our studies demonstrating the efficacy of various therapeutic interventions.
BKS-Lepr(-/-) Nos3(-/-) mouse model
Phenotypic Characteristics and Efficacy Evaluation of BKS-Lepr(-/-); Nos3(-/-) Mice

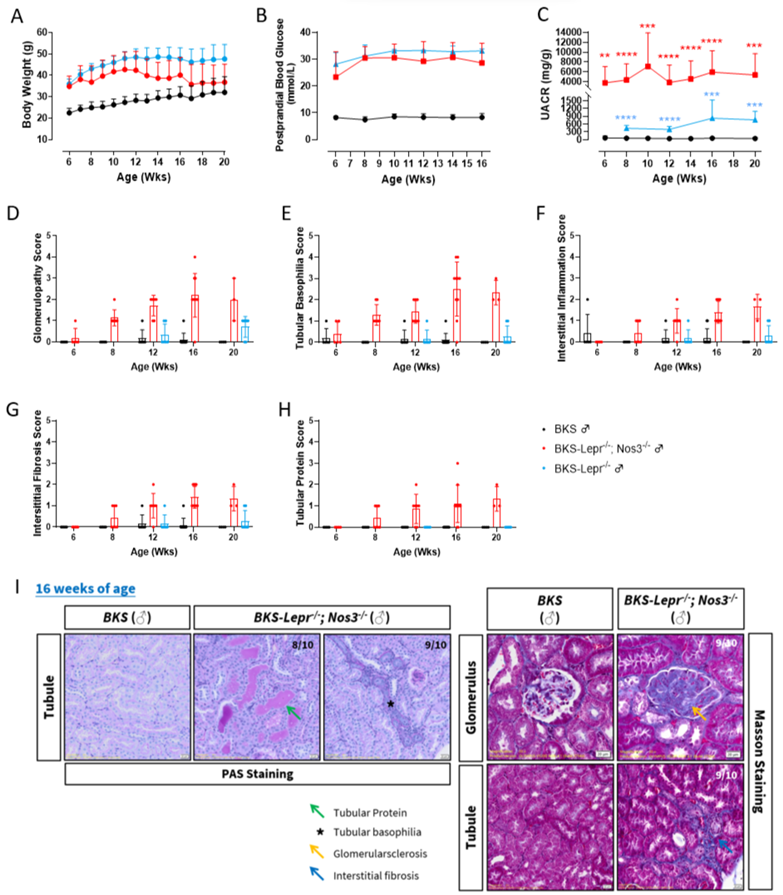
Nos3 deficiency markedly accelerates the development and progression of diabetic kidney disease in db/db mice without substantially affecting body weight or postprandial blood glucose levels. The dual-deficient model exhibits earlier and more severe albuminuria, progressive glomerular and tubular injury, increased interstitial inflammation, and pronounced renal fibrosis, demonstrating a robust and clinically relevant model of advanced diabetic nephropathy.
(A) Body weight progression during the study period; (B) postprandial blood glucose levels during the study period; (C) urinary albumin-to-creatinine ratio (UACR); (D) glomerulopathy scores; (E) tubular basophilia scores; (F) interstitial inflammation scores; and (G) representative renal histopathology at 16 weeks assessed by PAS and Masson staining, showing tubular protein casts (green arrow), basophilia (star), glomerulosclerosis (yellow arrow), and interstitial fibrosis (blue arrow). Groups were defined as follows: db/db mice and db/db Nos3-deficient mice, as indicated in the figure. Data are presented as mean ± SD. Statistical significance is indicated in the figure. ****, p < 0.0001 vs. db/db mice by one-way ANOVA with appropriate post-hoc comparisons.

BKS-Lepr(-/-) Nos3(-/-) mouse model
Synergistic Effects of Semaglutide and Lisinopril on Attenuating Diabetic Nephropathy in BKS-Lepr(-/-); Nos3(-/-) Mice
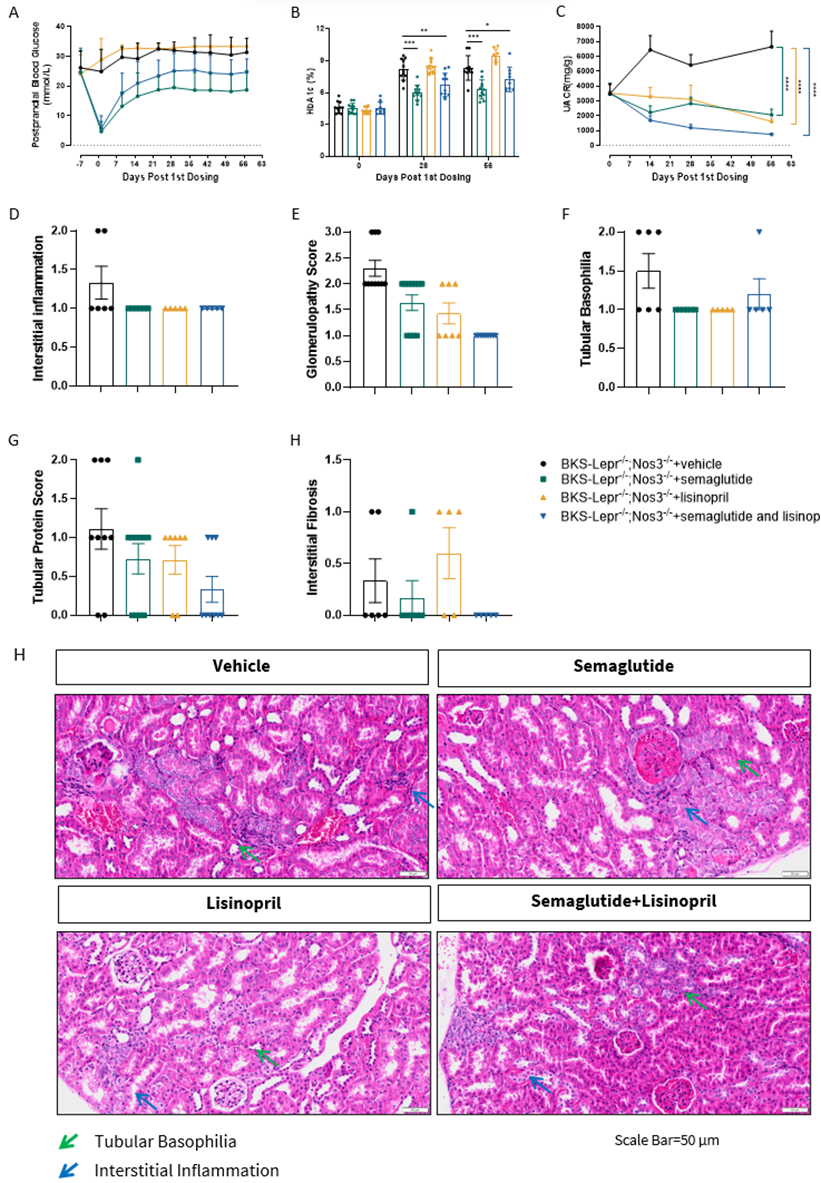
In BKS-Lepr-/-; Nos3-/- mice, Semaglutide markedly improved glycemic control and reduced the progression of diabetic kidney disease, while Lisinopril provided additional renoprotective effects. Combination treatment produced superior reductions in albuminuria and renal histopathological injury compared with either monotherapy, demonstrating synergistic benefits in both metabolic control and kidney protection.
(A) Postprandial blood glucose levels over time following the first dose; (B) HbA1c levels measured at baseline and on Days 28 and 66 post first dosing; (C) longitudinal urinary albumin-to-creatinine ratio (UACR); (D) interstitial inflammation score; (E) glomerulopathy score; (F) tubular basophilia score; (G) tubular protein cast score; (H) interstitial fibrosis score; and (I) representative hematoxylin and eosin (H&E)-stained kidney sections. Green arrows indicate tubular basophilia, and blue arrows indicate interstitial inflammation. Groups included BKS-Lepr(-/-);Nos3(-/-) mice treated with Vehicle, Semaglutide, Lisinopril, or Semaglutide plus Lisinopril, as indicated in the figure. Data are presented as mean ± SD. Statistical significance is indicated in the figure. *, p < 0.05; **, p < 0.01; and ***, p < 0.001 by one-way ANOVA with appropriate post-hoc comparisons. Scale bar = 50 μm.
AAV-mRenin-induced BKS-Lepr(-/-) Diabetic Nephropathy Model
Phenotypic Characteristics of AAV-mRenin Induced Diabetic Nephropathy in BKS-Lepr(-/-) Mice
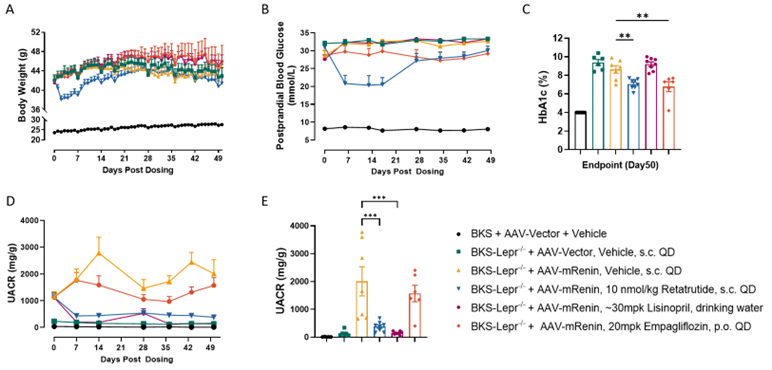
Figure 1: Therapeutic Effects of Retatrutide, Lisinopril, and Empagliflozin in AAV-mRenin–Induced Diabetic Nephropathy in BKS-Lepr(-/-) Mice
In AAV-mRenin–induced diabetic kidney disease mice, Retatrutide produced robust body weight reduction and strong improvements in glycemic control, while Empagliflozin provided moderate glucose-lowering effects and Lisinopril primarily exerted renoprotective benefits. Among all treatments, Retatrutide and Lisinopril significantly reduced albuminuria, whereas Empagliflozin showed a weaker effect on urinary albumin excretion, highlighting differential efficacy across metabolic and renal endpoints.
(A) Body weight changes during the 49-day treatment period; (B) postprandial blood glucose levels over time; (C) HbA1c levels at study endpoint (Day 50); (D) longitudinal urinary albumin-to-creatinine ratio (UACR); and (E) endpoint UACR levels. Groups included BKS + AAV-Vector + Vehicle, BKS-Lepr(-/-) + AAV-Vector + Vehicle, BKS-Lepr(-/-) + AAV-mRenin + Vehicle, BKS-Lepr(-/-) + AAV-mRenin + 10 nmol/kg Retatrutide, BKS-Lepr(-/-) + AAV-mRenin + ~30 mpk Lisinopril, and BKS-Lepr(-/-) + AAV-mRenin + 20 mpk Empagliflozin, as indicated in the figure. Data are presented as mean ± SD. Statistical significance is indicated in the figure. *, p < 0.05; **, p < 0.01; ***, p < 0.001; and ****, p < 0.0001 by one-way ANOVA with appropriate post-hoc comparisons.
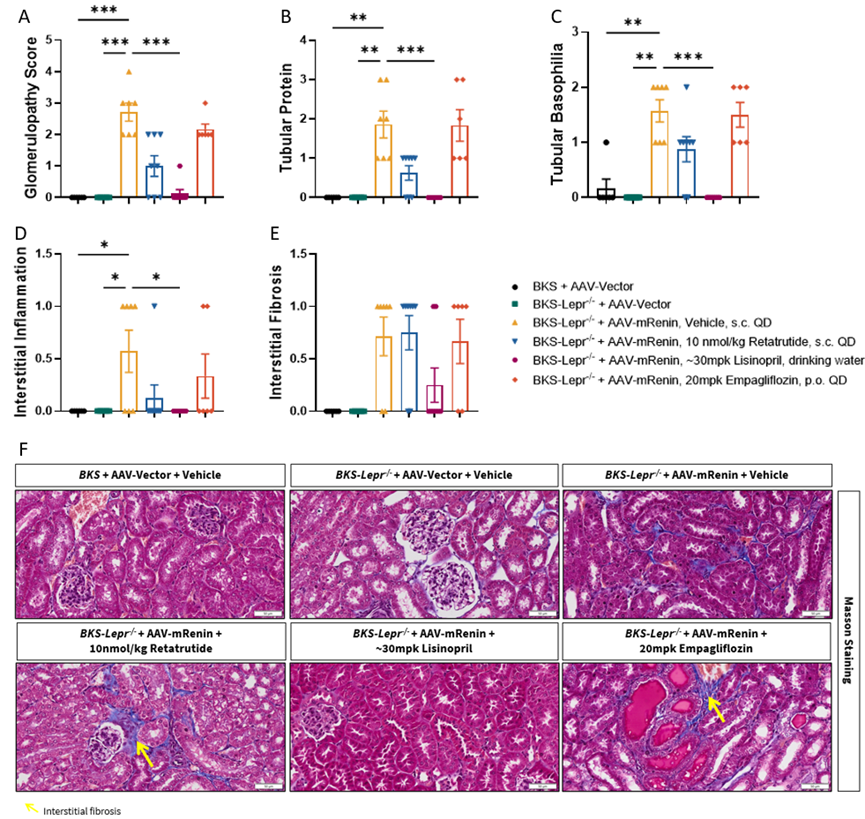
Figure 2: Histopathological Improvement and Reduction of Renal Fibrosis by Retatrutide, Lisinopril, and Empagliflozin in AAV-mRenin–Induced Diabetic Nephropathy in BKS-Lepr(-/-) Mice
Lisinopril significantly attenuated renal injury in diabetic mice by reducing glomerulopathy, tubular protein cast formation, and interstitial inflammation. Retatrutide also demonstrated marked renoprotective effects, improving both glomerular and tubular pathological changes. In contrast, Empagliflozin showed comparatively weaker effects on these histopathological parameters. Masson staining further revealed that Lisinopril and Retatrutide markedly reduced interstitial collagen deposition and preserved renal parenchymal integrity, supporting robust anti-fibrotic and renoprotective benefits.
(A) Glomerulopathy score; (B) tubular protein cast score; (C) tubular basophilia score; (D) interstitial inflammation score; (E) interstitial fibrosis score; and (F) representative Masson’s trichrome staining images of kidney sections. Yellow arrows indicate areas of interstitial fibrosis. Groups included BKS + AAV-Vector + Vehicle, BKS-Lepr(-/-) + AAV-Vector + Vehicle, BKS-Lepr(-/-) + AAV-mRenin + Vehicle, BKS-Lepr(-/-) + AAV-mRenin + 10 nmol/kg Retatrutide, BKS-Lepr(-/-) + AAV-mRenin + ~30 mpk Lisinopril, and BKS-Lepr(-/-) + AAV-mRenin + 20 mpk Empagliflozin, as indicated in the figure. Data are presented as mean ± SD. Statistical significance is indicated in the figure. *, p < 0.05; **, p < 0.01; ***, p < 0.001 by one-way ANOVA with appropriate post-hoc comparisons.
All Product Lines
Browse our comprehensive catalog of over 30,000 mouse models covering various gene families, signaling pathways, and disease models. Use advanced filters to find the perfect model for your research.


- 1
- 2
- 3
- 4
- 5
- 6
- 12
Recommended for You
Discover related models and services to accelerate your research

Accelerate Your Research
Download



Newsletter Signup


We value your privacy
This website will store cookies on your computer. These cookies are used to collect information about how you interact with this website and enable us to remember you. We use this information to improve and customize your browsing experience, as well as to analyze and collect relevant data and metrics about visitors on this website and other platforms. For more information about the cookies we use, please refer to our privacy policy
If you decline, your information will not be tracked when visiting this website. A cookie will be used in your browser to remember your preference settings that you have not accepted.


Contact Us
Schedule a Meeting
Let us know which event you're attending and we'd be happy to connect with you.