


- By Indication
 Inflammatory and Autoimmune DiseasesRespiratory DiseasesInfectious DiseasesRare DiseaseGut Microbiota Research ServiceBy Modality
 Preclinical Model Strategies for T-Cell Engagers: From Oncology to Autoimmune Disease
 2026-10-27
 11:00 AM ET
 Dr. Wanjun Yuan & Dr. Haiqiao SunOne TCE Modality. Two Disease Contexts. Different Preclinical Questions.
'/%3e%3c/svg%3e)

Heart Failure with Reduced Ejection Fraction (HFrEF)

- 4Validated Models
- 40+Studies Completed
- 8IND-Enabling Studies
Our Advantages
Industry-leading capabilities for heart failure research

Expert Modeling & Efficacy Evaluation
With expertise in modeling and efficacy evaluation, we can design customized experiments based on client drug profiles and have supported more then a dozen IND application projects.
01
High-Throughput LAD Modeling
We employ high-throughput LAD modeling technology, capable of constructing 50-60 models per day with minimally invasive procedures.
02
Standardized In Vivo Assessment
Our standardized in vivo assessment platform includes echocardiography and PV loop measurements.
03
Model Library
Comprehensive heart failure models for preclinical research

Case Studies & Validation Data
Explore our validated heart failure studies demonstrating the efficacy of various therapeutic interventions.
LAD Model and Efficacy Study
Model Characterization

(A) Representative ECG waveforms; (B) Body weight data; (C) Survival rate following surgery. Deaths typically occurred within 7 days post LAD surgery.
LAD-Induced Ventricular Remodeling (1 Week Post-Surgery)
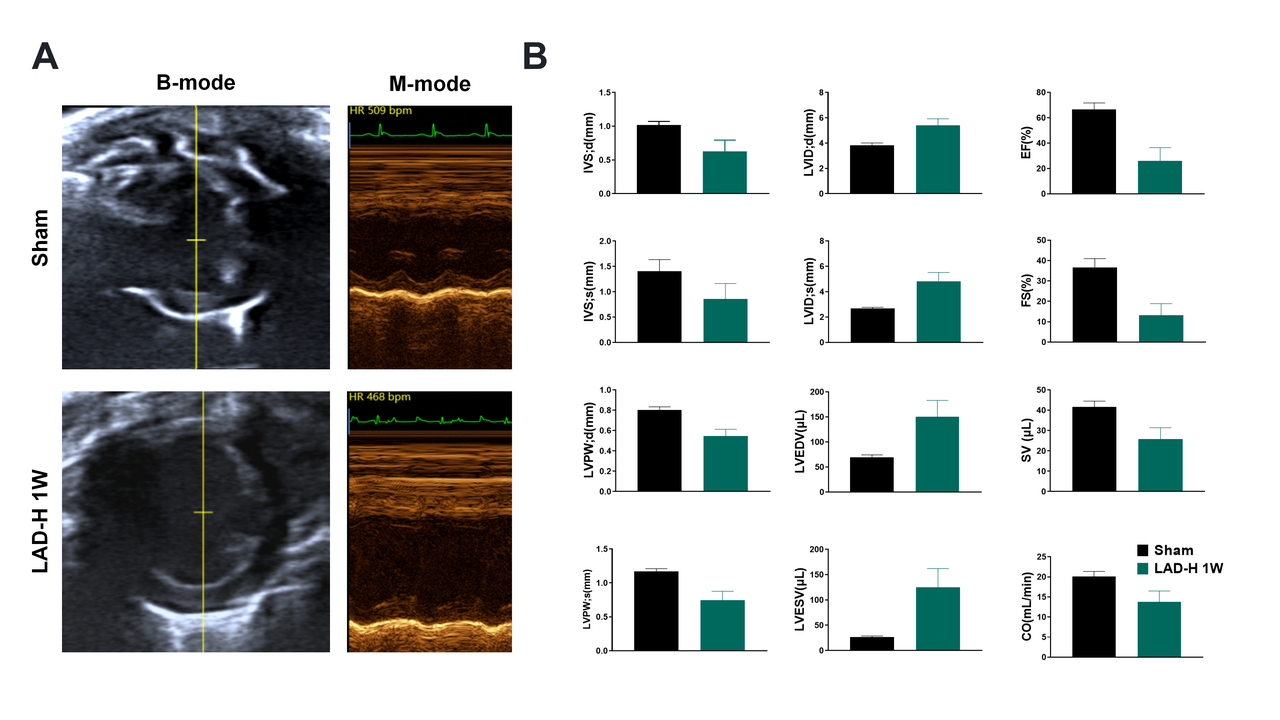
(A) Parasternal B-/M-mode images. (B) Echo data: Structural (IVSd/s, LVPWd/s), dimensional (LVIDd/s, LVEDV/ESV), and functional (EF, FS, SV, CO) parameters. The LAD group shows anterior wall thinning, LV dilation, and systolic dysfunction.
LAD Induces Advanced Heart Failure (2 Weeks Post-Surgery).
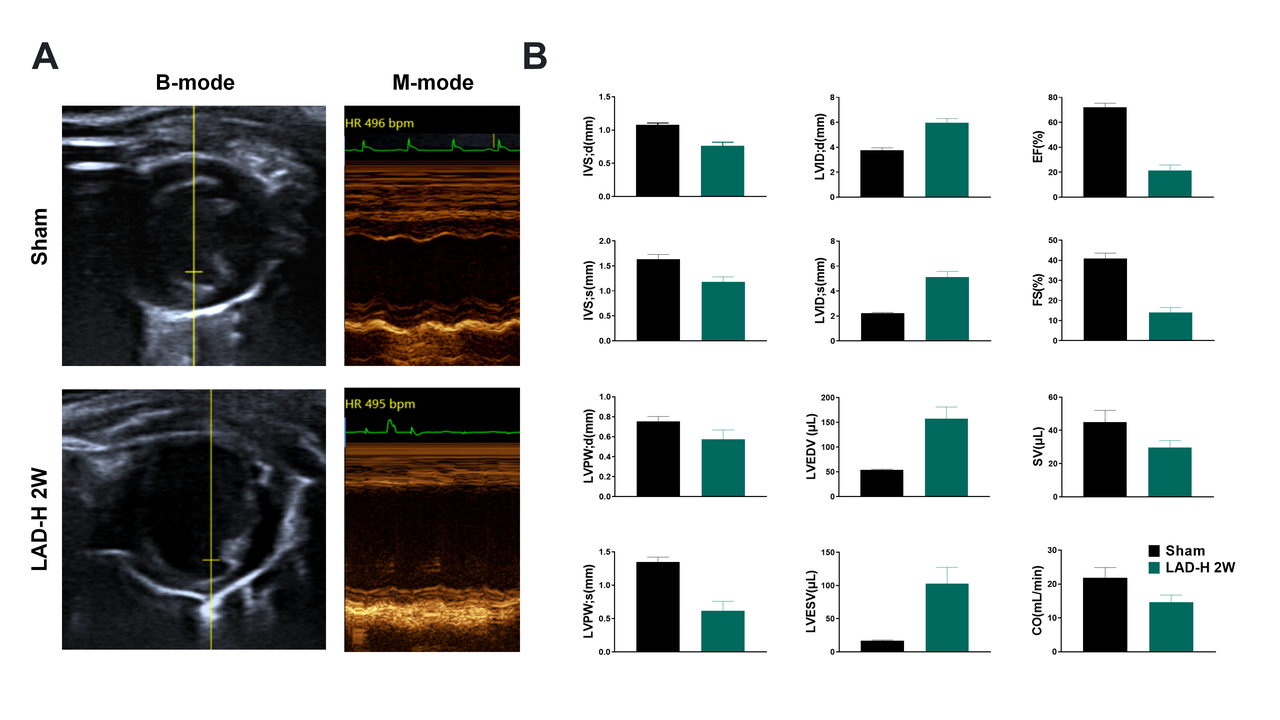
(A) Parasternal B-/M-mode images. (B) Echo data: Structural (IVSd/s, LVPWd/s), dimensional (LVIDd/s, LVEDV/ESV), and functional (EF, FS, SV, CO) parameters. The LAD group shows anterior wall thinning, LV dilation, and systolic dysfunction.
LAD Induces Advanced Heart Failure (4 Weeks Post-Surgery).
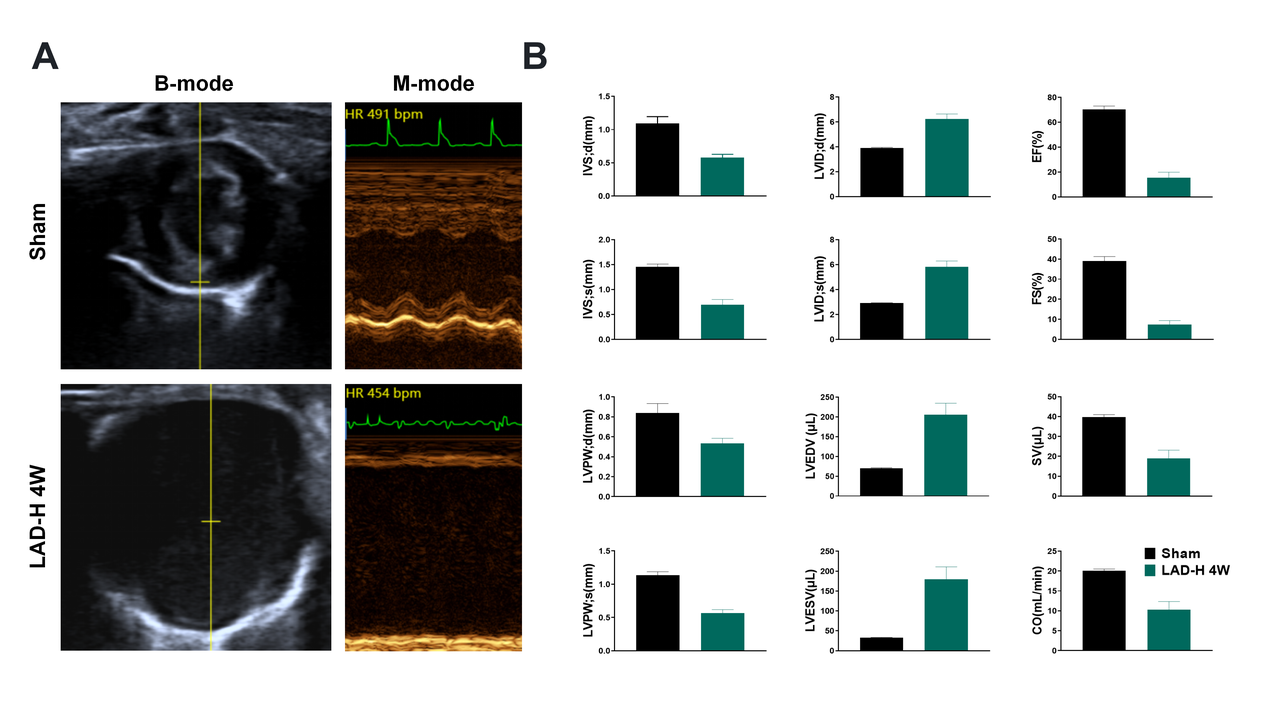
(A) Parasternal B-/M-mode images. (B) Echo data shows ventricular dilation, systolic dysfunction (reduced EF/FS), and arrhythmias. Parameters: wall thickness (IVSd/s, LVPWd/s), dimensions (LVIDd/s, LVEDV/ESV), and function (SV, CO).
Cardiac Remodeling in LAD Model
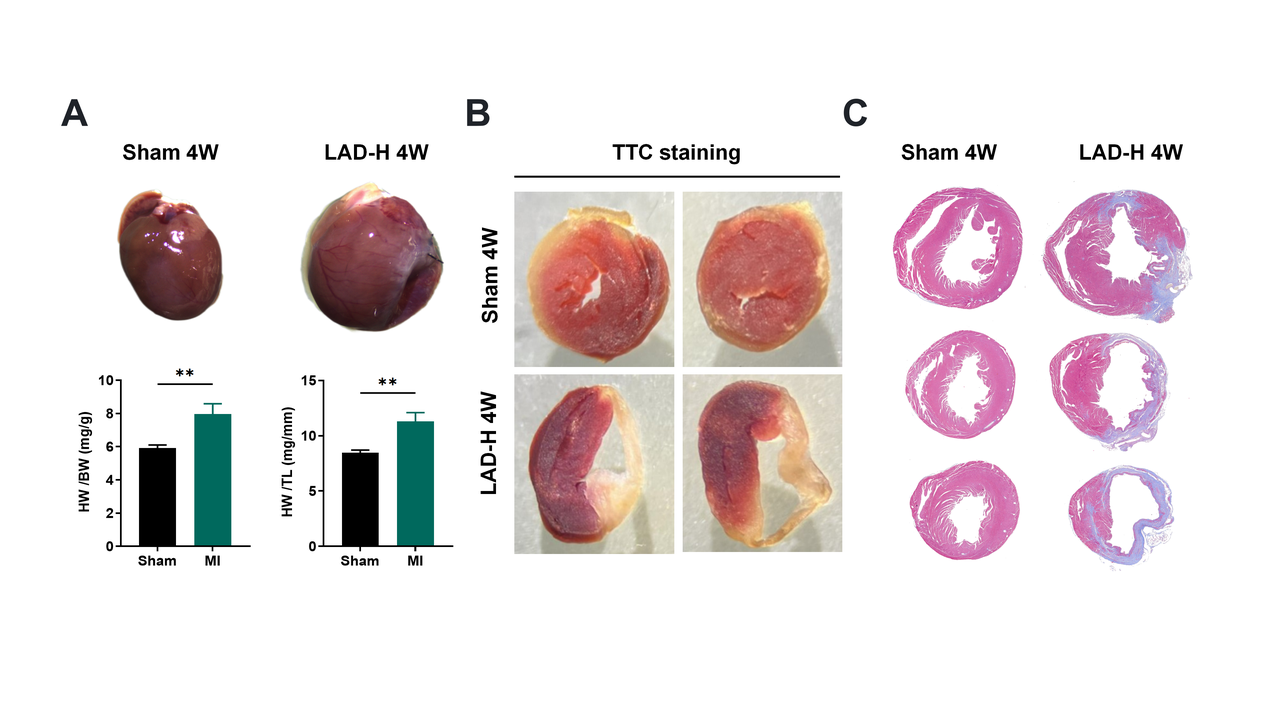
(A) Gross morphology shows ventricular wall thinning and LV dilation. Heart weight/body weight (HW/BW) and HW/tibia length (HW/TL) ratios are elevated. (B) TTC staining: white indicates infarct region. (C) Masson's trichrome blue indicates fibrotic scars.
Entresto Treatment Effects on Cardiac Function in LAD Model.
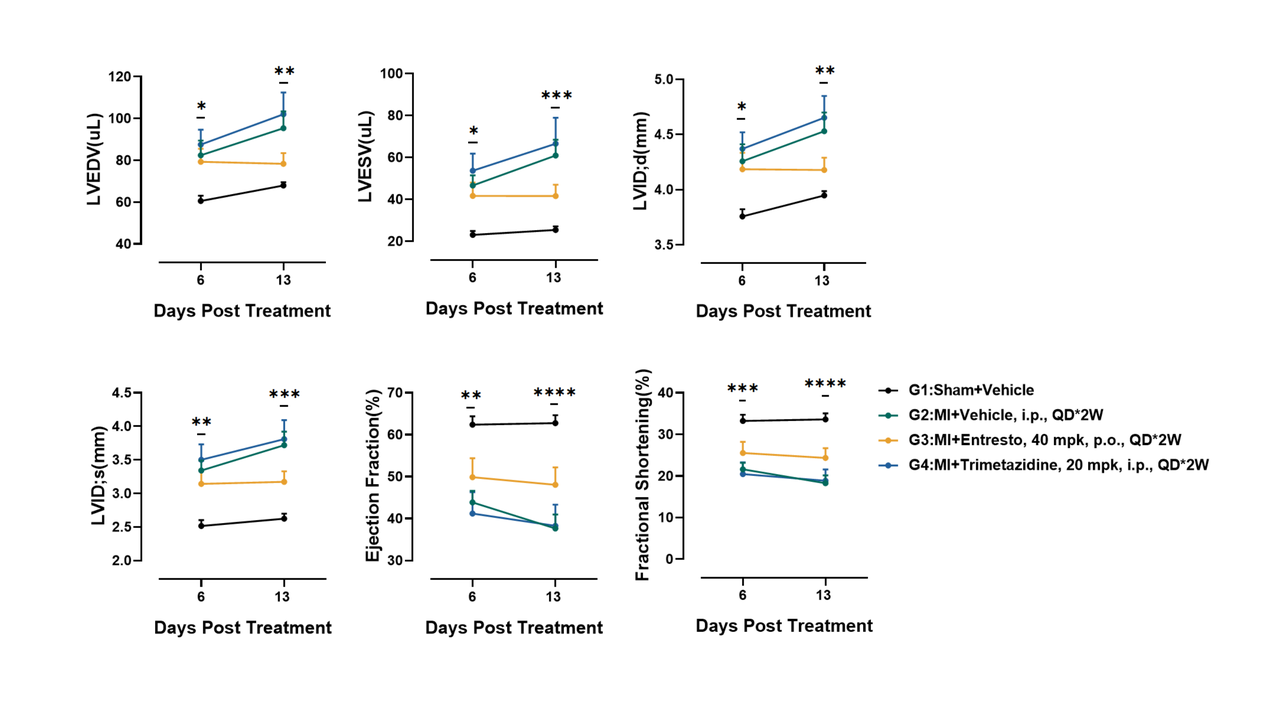
Mice received Entresto (Sac/Val) for 2 weeks post-modeling. Treatment slowed HF progression, primarily by reducing LV dilation (LVIDd/s, LVEDV, LVESV) and improving systolic function (EF, FS).
Entresto Reduces Infarct Size in Post-LAD-2-Week Model.
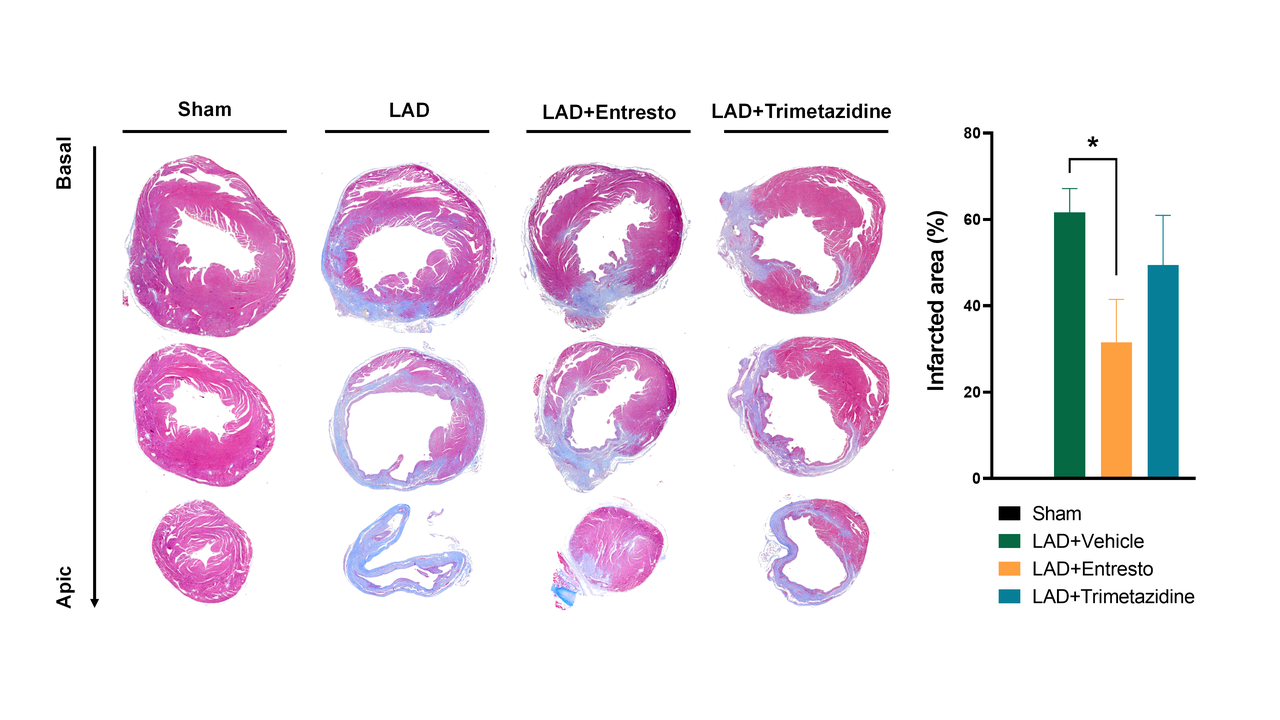
Entresto (Sac/Val) treatment demonstrated a cardioprotective effect, significantly reducing the infarct area. Quantification was performed using the midline method on multi-sectional Masson's trichrome-stained images (shown, apical to base), which demarcate fibrotic scars (blue).

MIRI model
Cardiac function and structure at 24 hpa in the MIRI model.
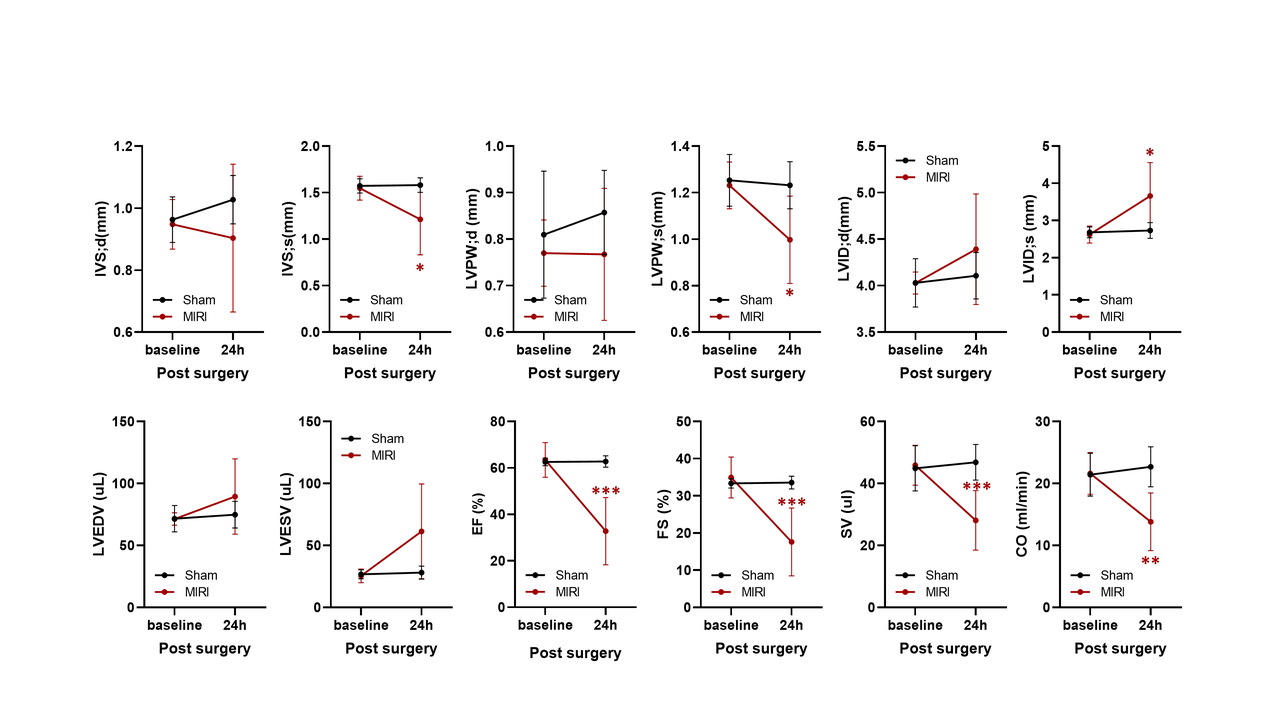
Sham vs. MIRI groups at baseline (0h) and 24h post-op. MIRI shows significantly impaired systolic function (↓EF, FS, SV, CO), ventricular dilation (↑LVID;s/d, LVEDV, LVESV), and altered wall thickness at 24h (*p<0.05, **p<0.01).
Cardiac function and structure at 7 days post-op in the MIRI model.
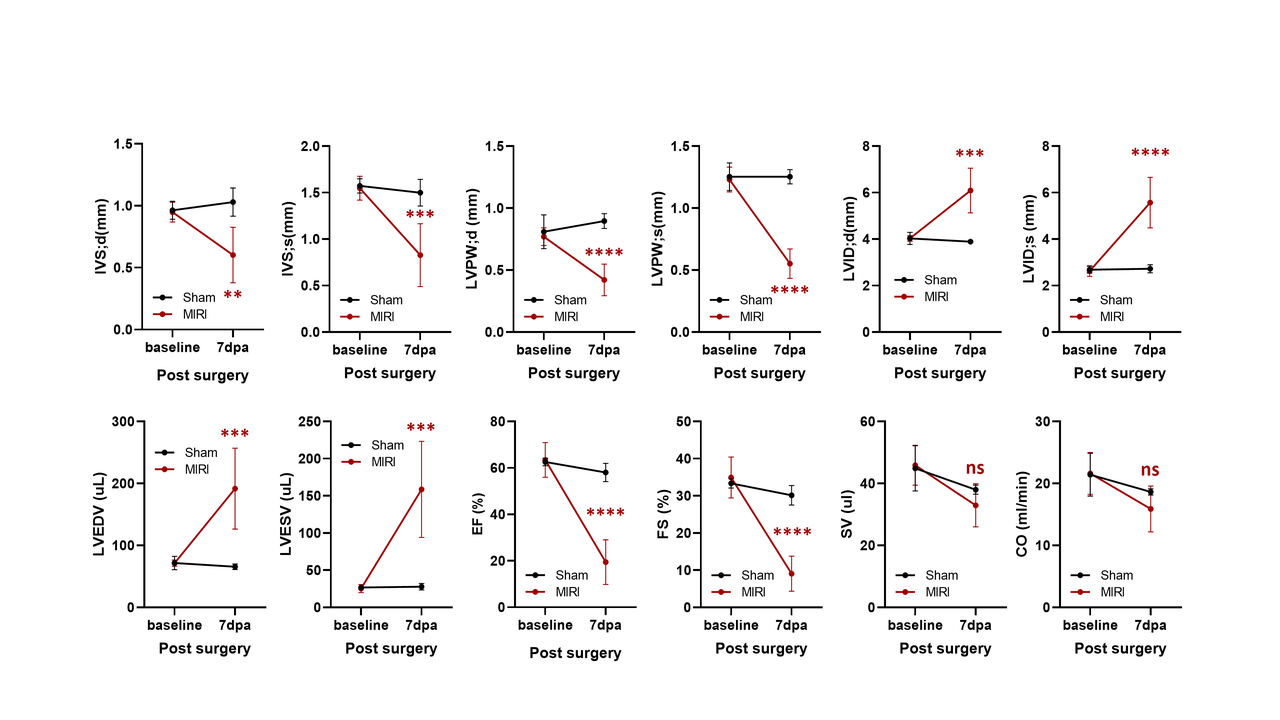
Echo panel comparing Sham (●) and MIRI (◆) groups at baseline and 7 days post-op. MIRI shows significant systolic dysfunction (↓EF, FS, CO), ventricular dilation (↑LVEDV, LVESV, LVID;d), and altered wall thickness (IVS;d, LVPW;d) vs. Sham at 7dpa (ns, *, ,*). Data: mean±SEM.
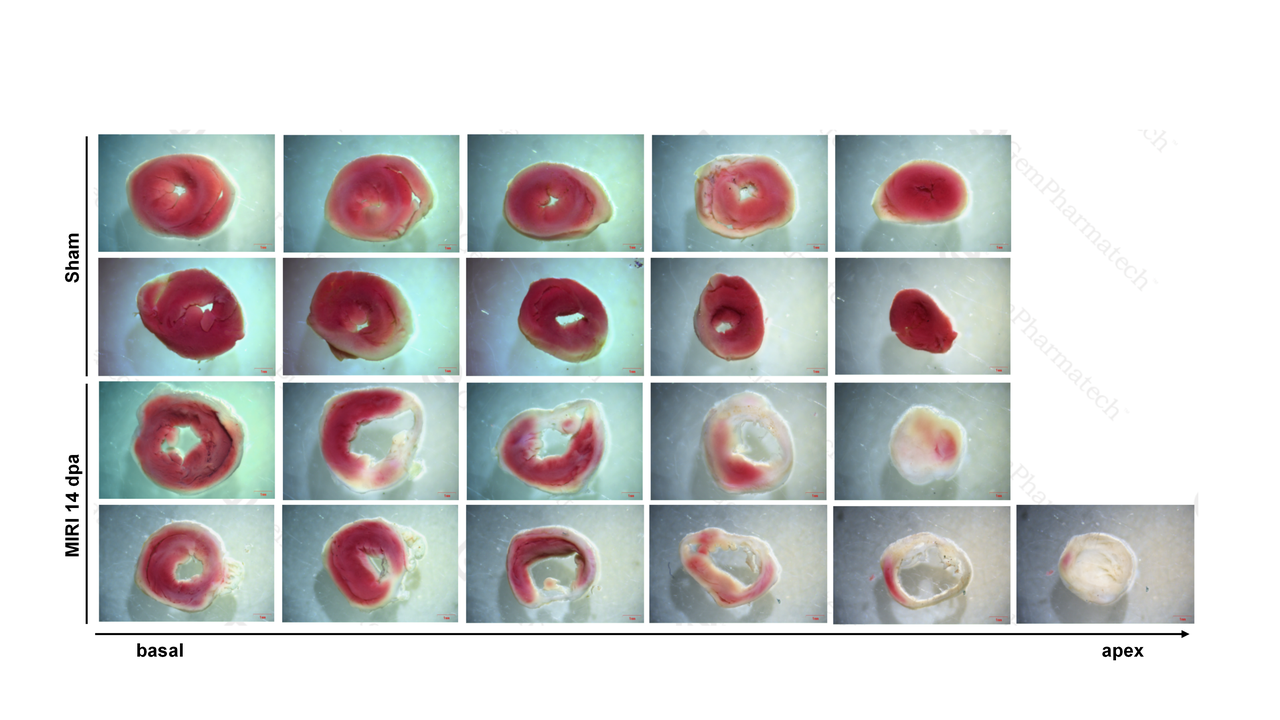
TTC staining for myocardial viability in the MIRI model.
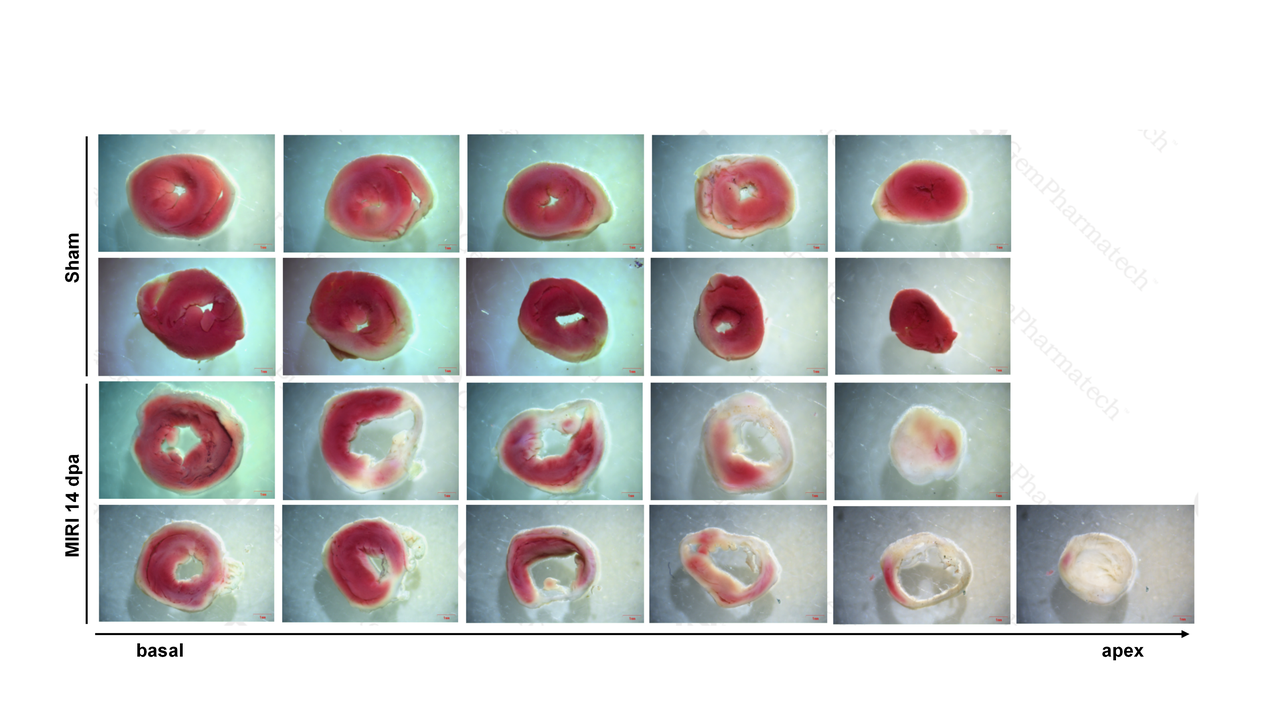
Transverse heart sections (base to apex) from Sham and MIRI (14 days post-op) mice. Sham myocardium is uniformly brick-red (viable). MIRI hearts show extensive pale, unstained areas across sections, indicating transmural infarction.
TAC Model and Efficacy Study
TAC Model Validation & Variability.
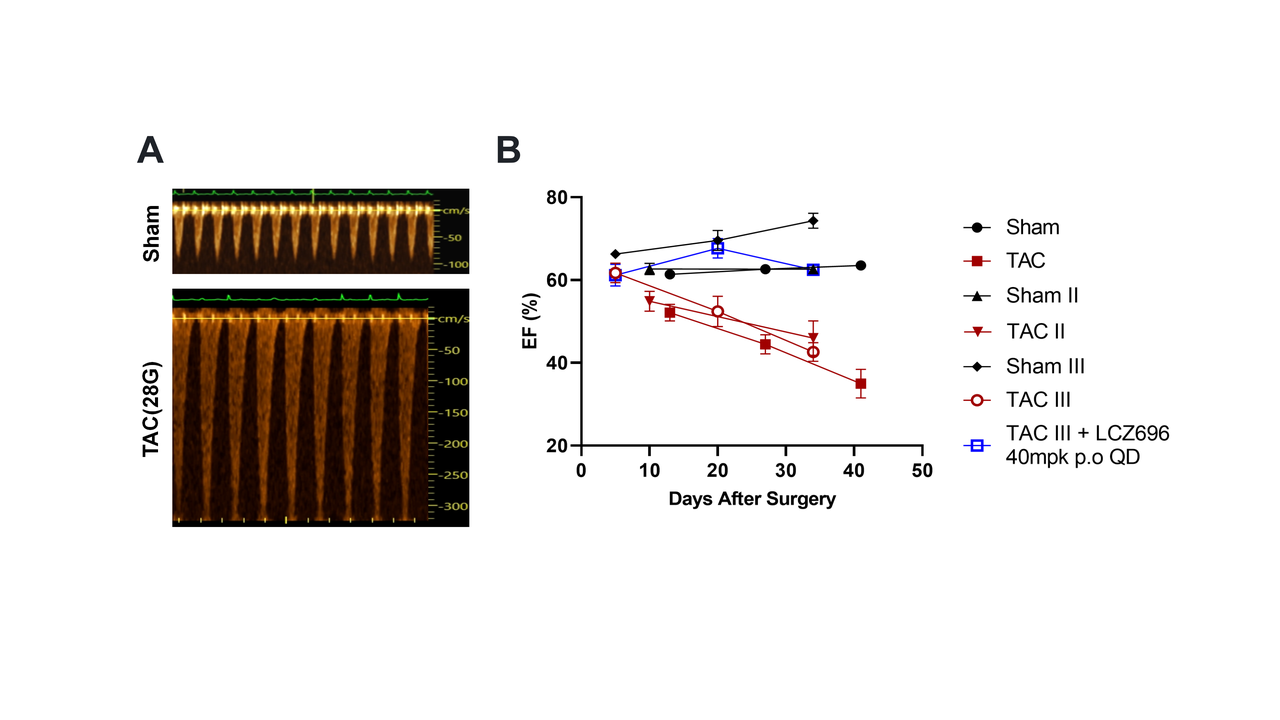
TAC Model Time Course (28G).
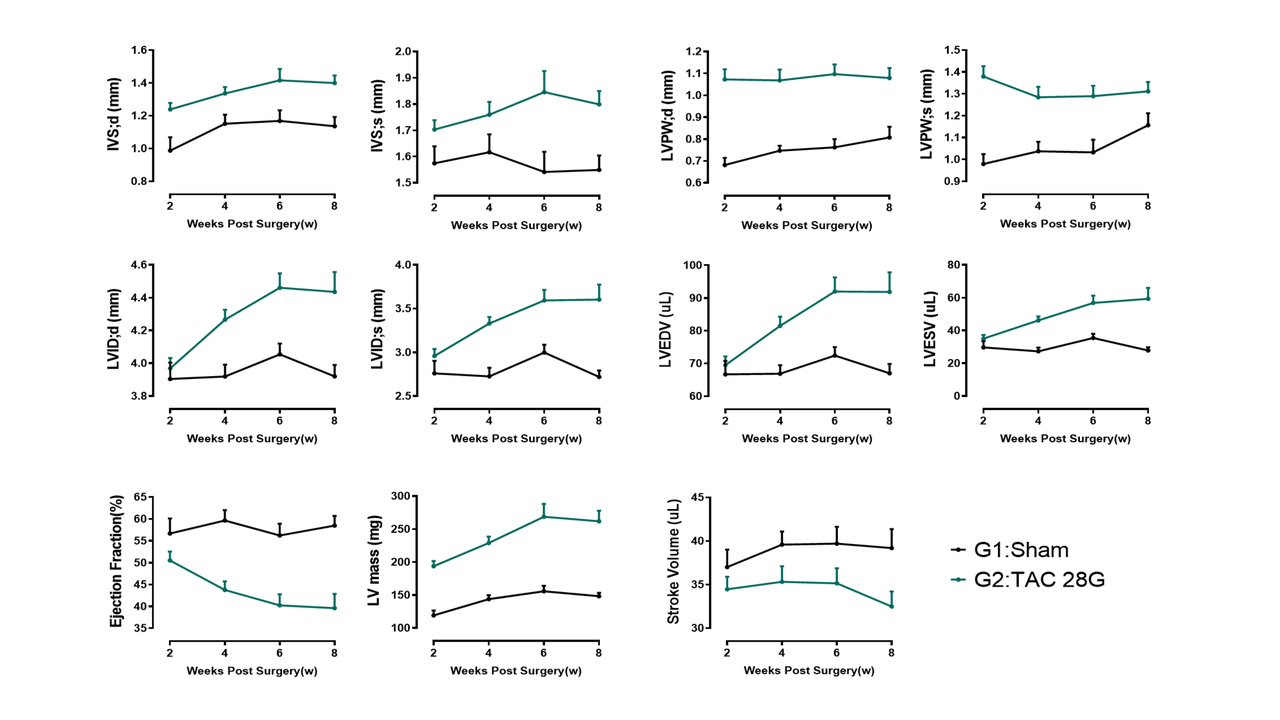
After 28G TAC surgery: 2-3 weeks shows compensatory ventricular hypertrophy (↑IVSd/s, LVPWd/s, LV dMass). By 4 weeks, ventricular dilation (↑LVIDd/s, LVEDV/ESV) and systolic dysfunction (↓EF, SV) develop, worsening over time.
TAC (28G) induces cardiac hypertrophy and fibrosis.
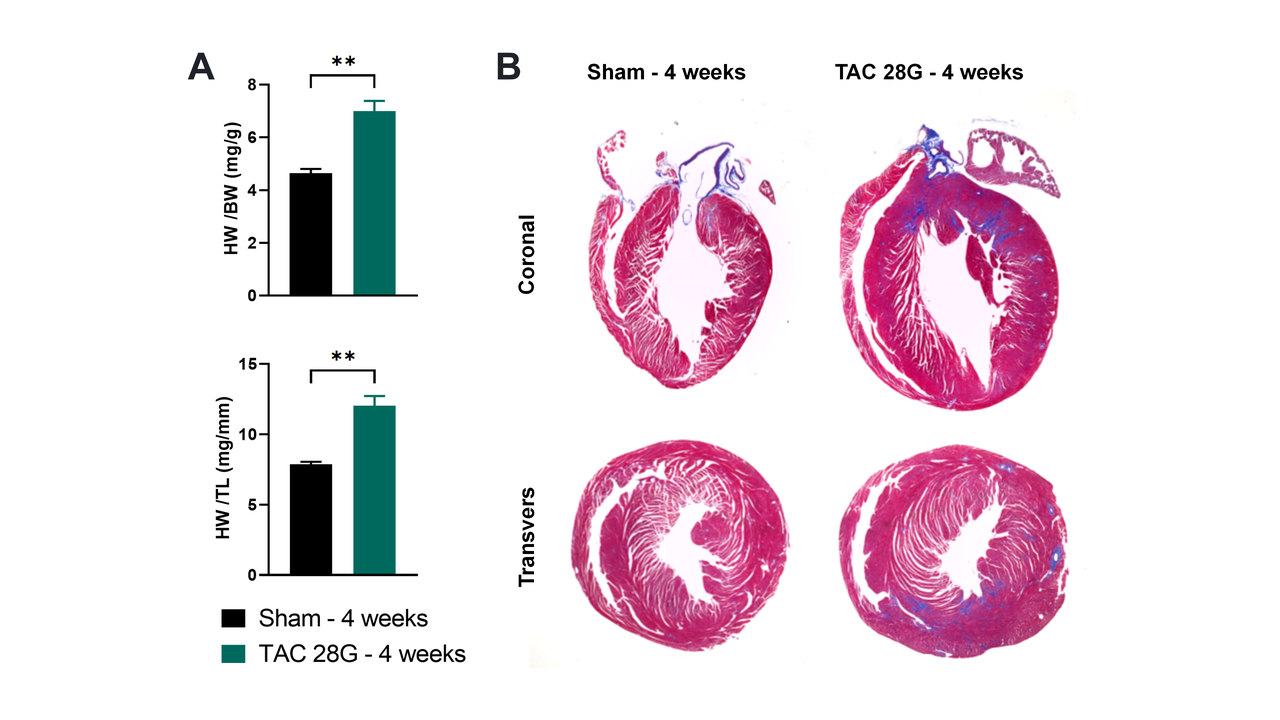
(A) HW/BW and HW/TL ratios are significantly increased. (B) Coronal sections show enlarged hearts, thickened walls, dilated chambers, and marked fibrosis (replacement, perivascular, interstitial).
Entresto prevents cardiac remolding and improves systolic function in TAC model.
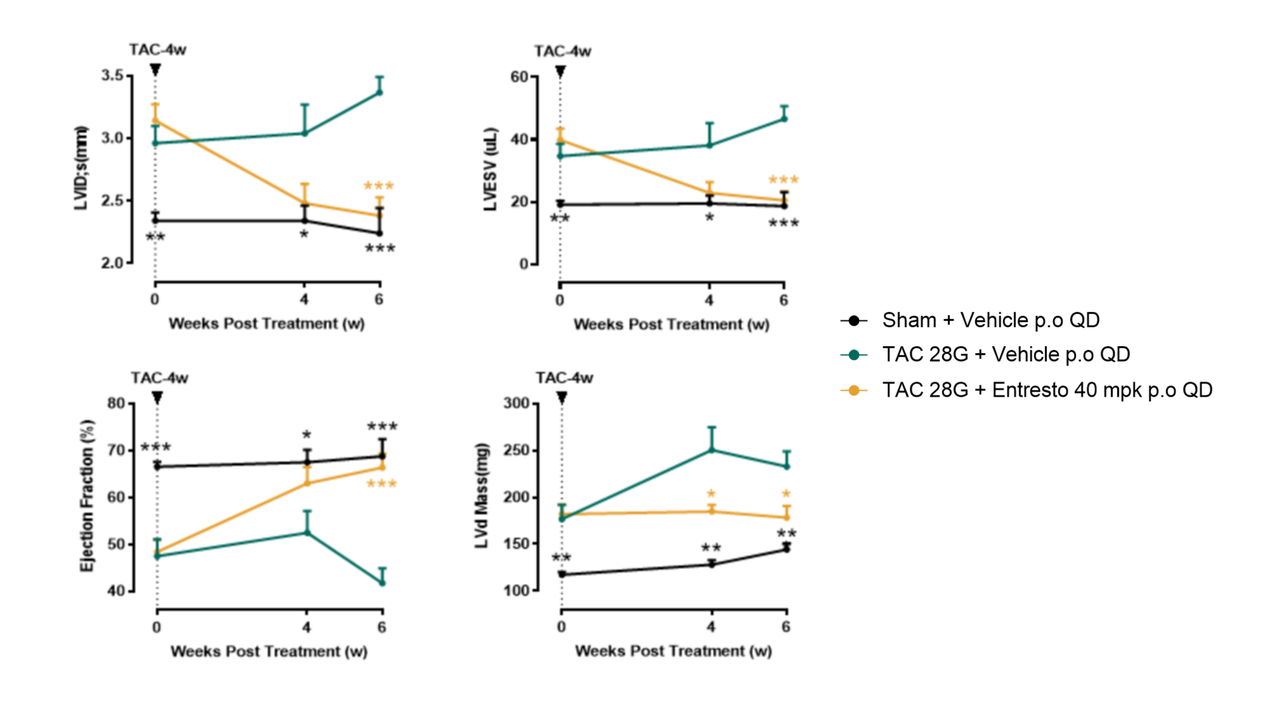
After 6-week Entresto (Sac/Val) treatment starting 4 weeks post-TAC (28G), phenotypes of ventricular dilation (↓LVESV) and systolic dysfunction (↑EF) were reversed, with a slight reduction in wall hypertrophy (trend in IVSd/s, LV dMass).
ISO infusion model
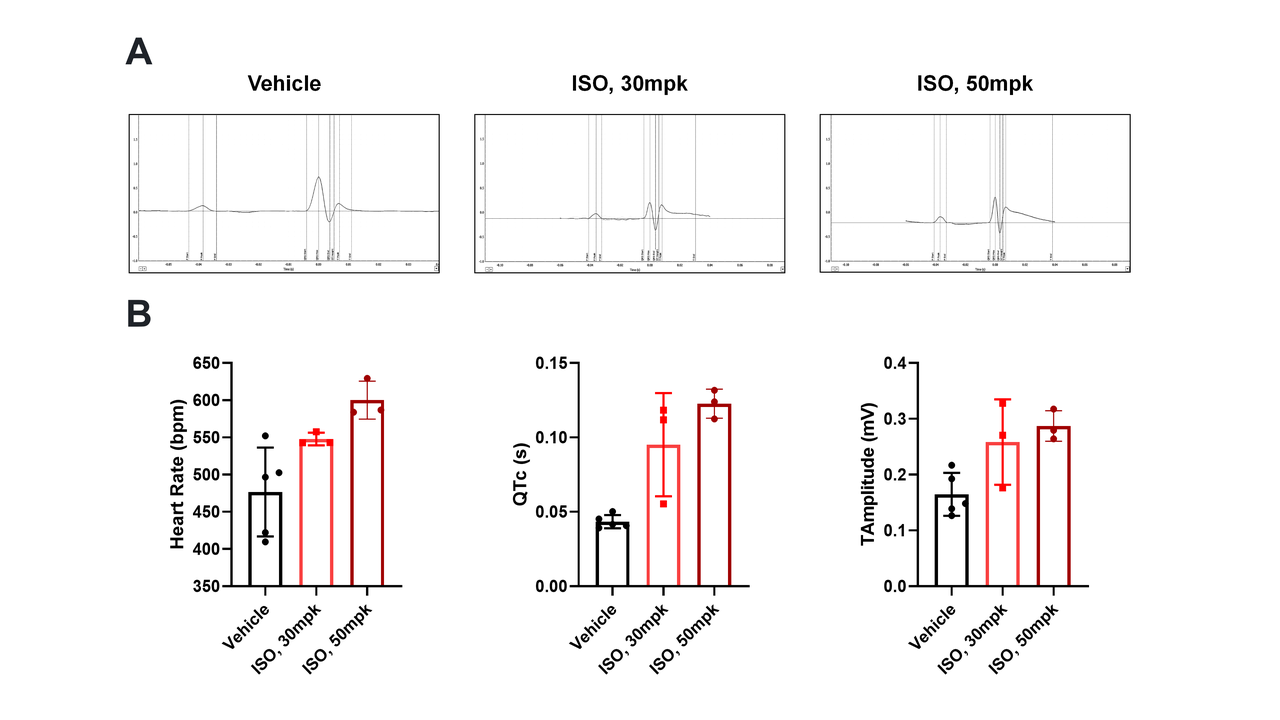
ISO Induces Dose-dependent ECG Changes.
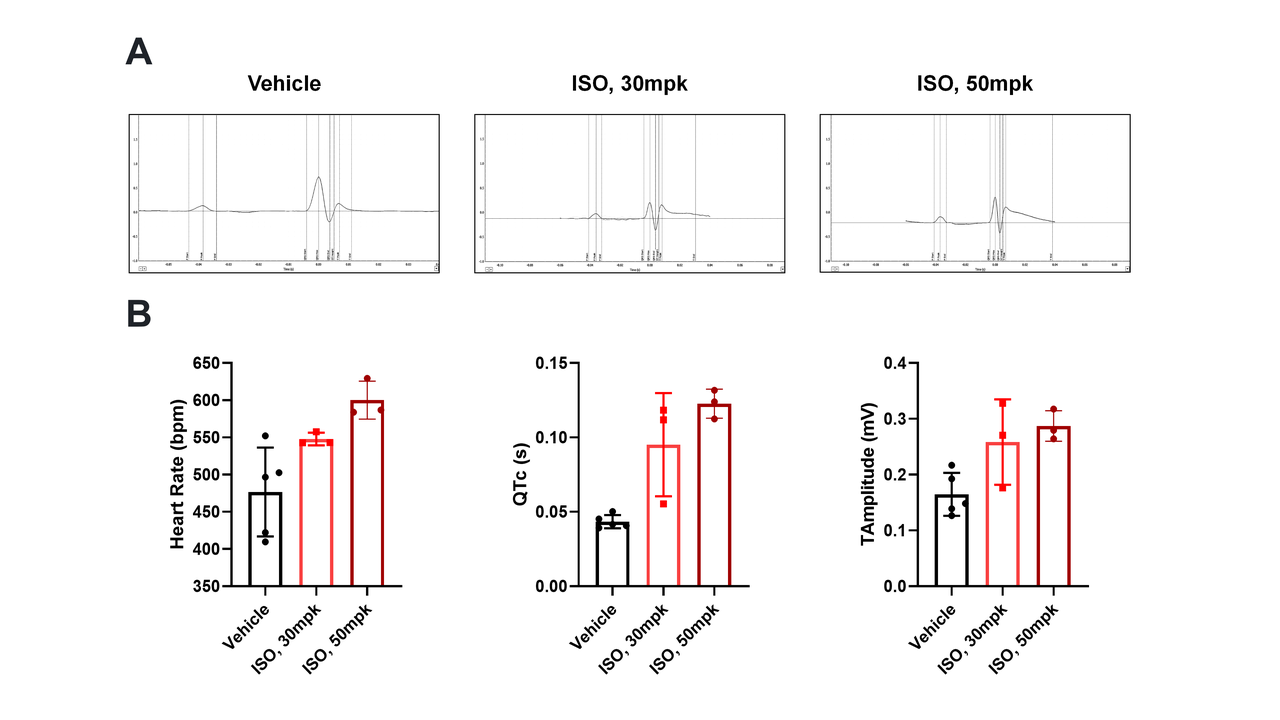
(A) Representative ECG waveforms and (B) statistical analysis from mice treated with ISO (30/50 mpk, osmotic pump). Increasing ISO concentration significantly prolonged the QT interval and elevated the ST segment and T wave.
ISO reduces cardiac function.
Echocardiography shows that increasing ISO concentration elevates LV mass (indicating hypertrophy/edema) while significantly decreasing EF% and FS%, demonstrating impaired systolic function and pump failure.
ISO dose effects on myocardial structure.
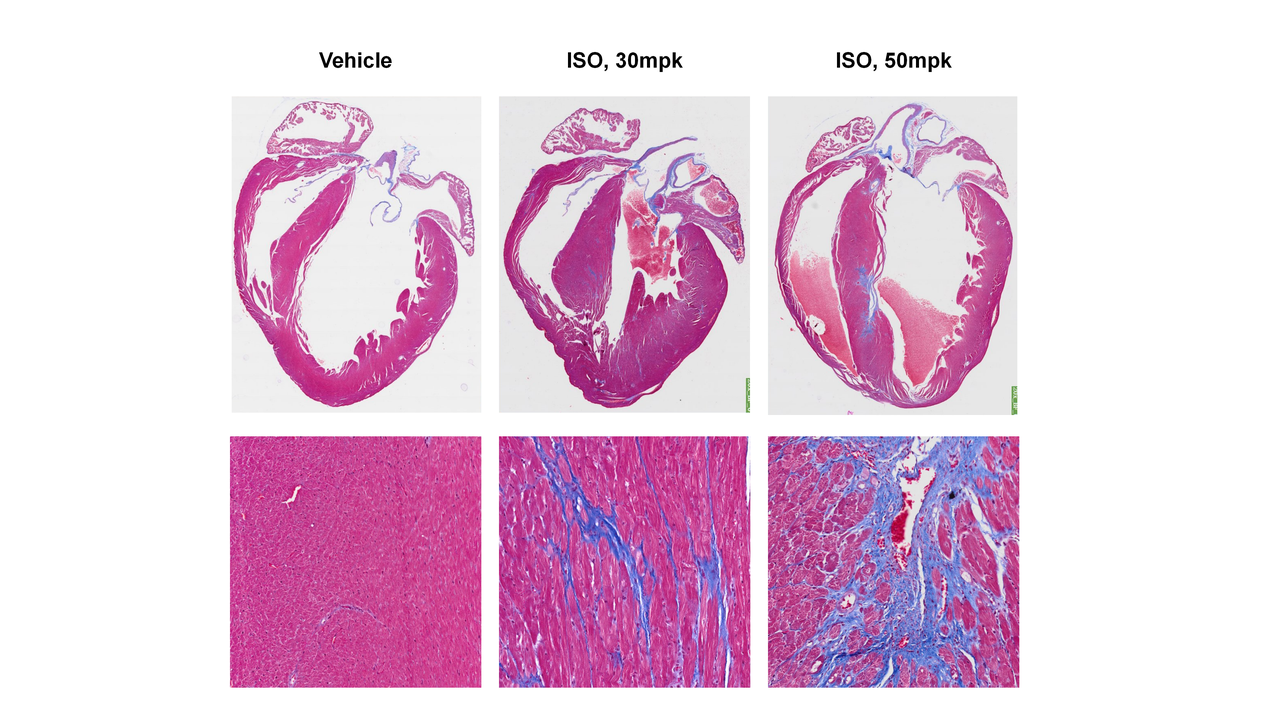
Masson staining reveals 30 mpk ISO causes compensatory ventricular wall thickening. The 50 mpk dose leads to extensive cardiomyocyte death, resulting in wall thinning, ventricular cavity enlargement, and increased fibrosis.
All Product Lines
Browse our comprehensive catalog of over 30,000 mouse models covering various gene families, signaling pathways, and disease models. Use advanced filters to find the perfect model for your research.


- 1
- 2
- 3
- 4
- 5
- 6
- 9
Recommended for You
Discover related models and services to accelerate your research

Accelerate Your Research
Download



Newsletter Signup


We value your privacy
This website will store cookies on your computer. These cookies are used to collect information about how you interact with this website and enable us to remember you. We use this information to improve and customize your browsing experience, as well as to analyze and collect relevant data and metrics about visitors on this website and other platforms. For more information about the cookies we use, please refer to our privacy policy
If you decline, your information will not be tracked when visiting this website. A cookie will be used in your browser to remember your preference settings that you have not accepted.


Contact Us
Schedule a Meeting
Let us know which event you're attending and we'd be happy to connect with you.