


- By Indication
 Inflammatory and Autoimmune DiseasesRespiratory DiseasesInfectious DiseasesRare DiseaseGut Microbiota Research ServiceBy Modality
 Preclinical Model Strategies for T-Cell Engagers: From Oncology to Autoimmune Disease
 2026-10-27
 11:00 AM ET
 Dr. Wanjun Yuan & Dr. Haiqiao SunOne TCE Modality. Two Disease Contexts. Different Preclinical Questions.

'/%3e%3c/svg%3e)

Cardiomyopathy

- 7+Validated Models
- 40Studies Completed
- 10IND Studies Completed
Our Advantages
Industry-leading capabilities for Coronary Heart Disease (CHD)

Advanced Cardiac Imaging
Longitudinal echocardiographic monitoring of cardiac remodeling and dysfunction.
01
Specialized HCM Analysis
Proprietary PV loop data and analytical capabilities in HCM study.
02
Comprehensive Drug Development
Extensive model resources and pharmacodynamic expertise, including small molecules, AAV-based therapies, gene correction therapeutics.
03
CHD Models
SR-BI Mutation

Case Studies & Validation Data
Explore our studies demonstrating the efficacy of various therapeutic interventions.
Mybpc3 KO
Echocardiographic Characterization of Mybpc3 -/- (KO) Mice.

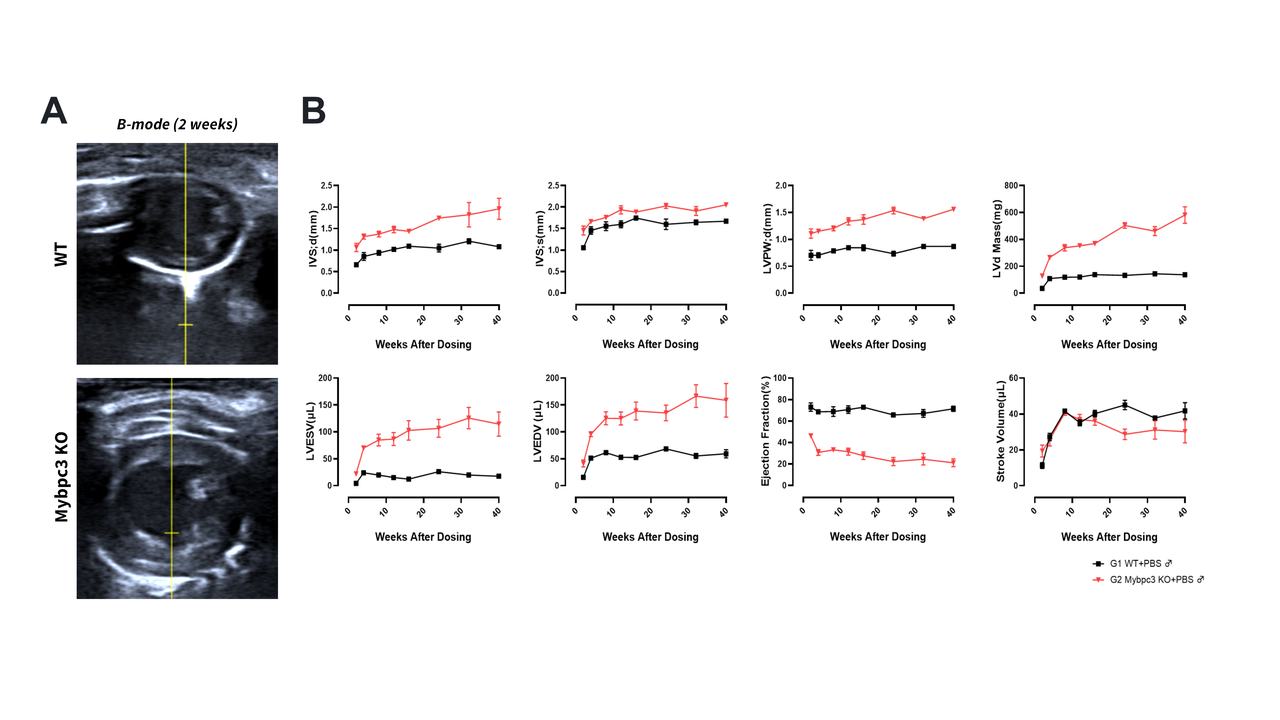 (A) Representative B-mode images at 2 weeks. (B) Longitudinal cardiac parameters (0-40 weeks) in WT vs. Mybpc3 KO mice. Top row: Wall thickness and mass (IVS;d, IVS;s, LVPW;d, LVMass). Bottom row: Chamber volume and function (LVESV, LVEDV, EF%, SV). KO mice show progressive hypertrophy, dilation, and declining function.
Mybpc3 KO Hearts Show Progressive Pathology
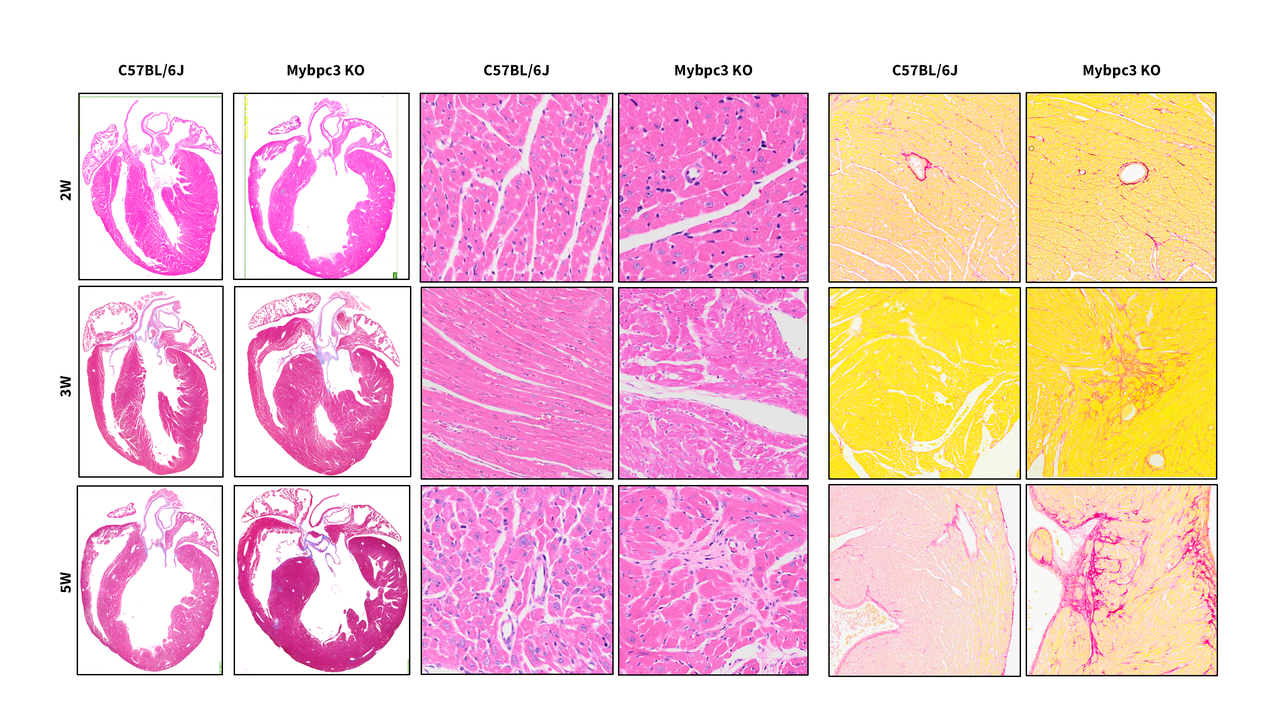 Gross morphology, H&E, and Masson's trichrome stains at 2, 3, and 5 weeks. Compared to WT, Mybpc3 KOhearts show progressive ventricular dilation, myofiber disarray, tissue damage, and replacement fibrosis, indicating severe pathological remodeling.
Mybpc3 KO Mice Exhibit Cardiac Hypertrophy and Remodeling.
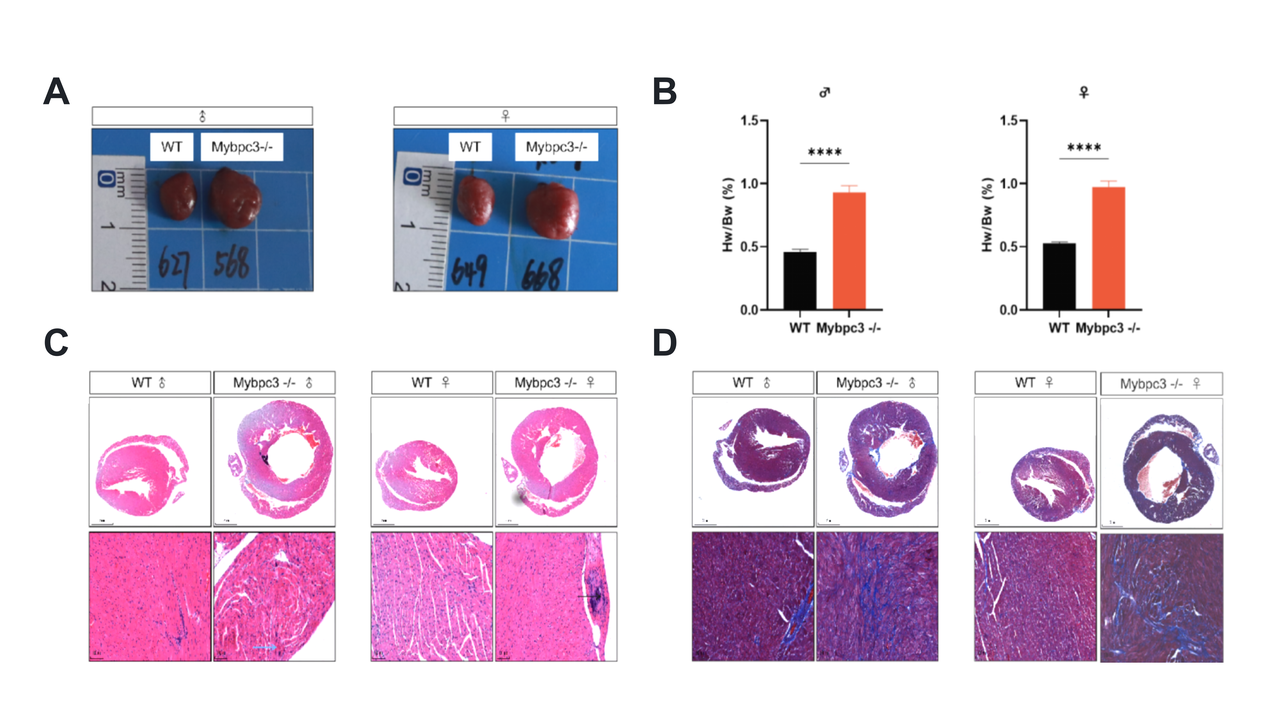 (A) Gross heart morphology shows enlargement. (B) HW/BW ratio is significantly increased (****p<0.0001) in both sexes. (C) H&E staining reveals cellular disarray. (D) Masson’s trichrome highlights fibrosis.

Myh6 R404Q
Echocardiographic Characterization of Myh6 R404Q/+ Mice.
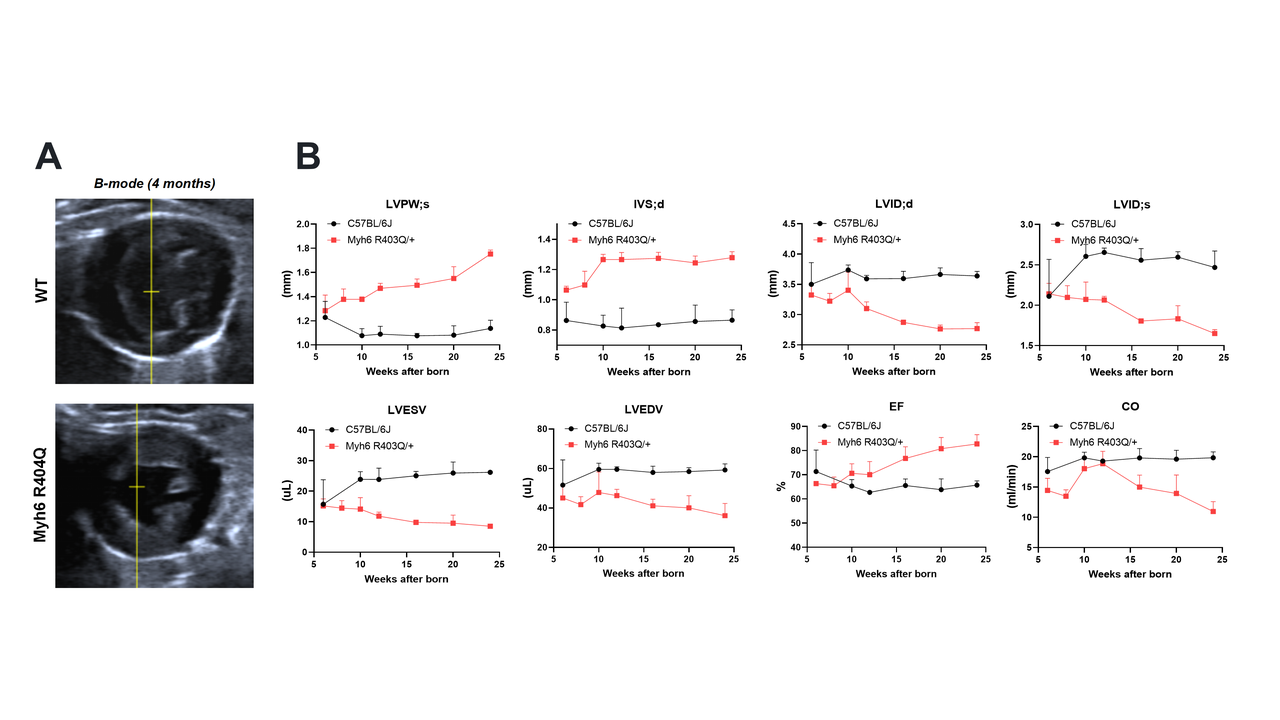
(A) B-mode images at 4 months show left ventricular chamber dilation in Myh6 R404Q*/+ vs. WT. (B) Longitudinal data (5-25 wks) plot wall thickness (LVPW;s, IVS;d), dimensions (LVID;d/s), volume (LVESV, LVEDV), and function (EF, CO), demonstrating pathological remodeling.
*Note: Myh6 R404Q corresponds to MYH7 R403Q.
PV Loop of Myh6 R404Q/+ Mice.
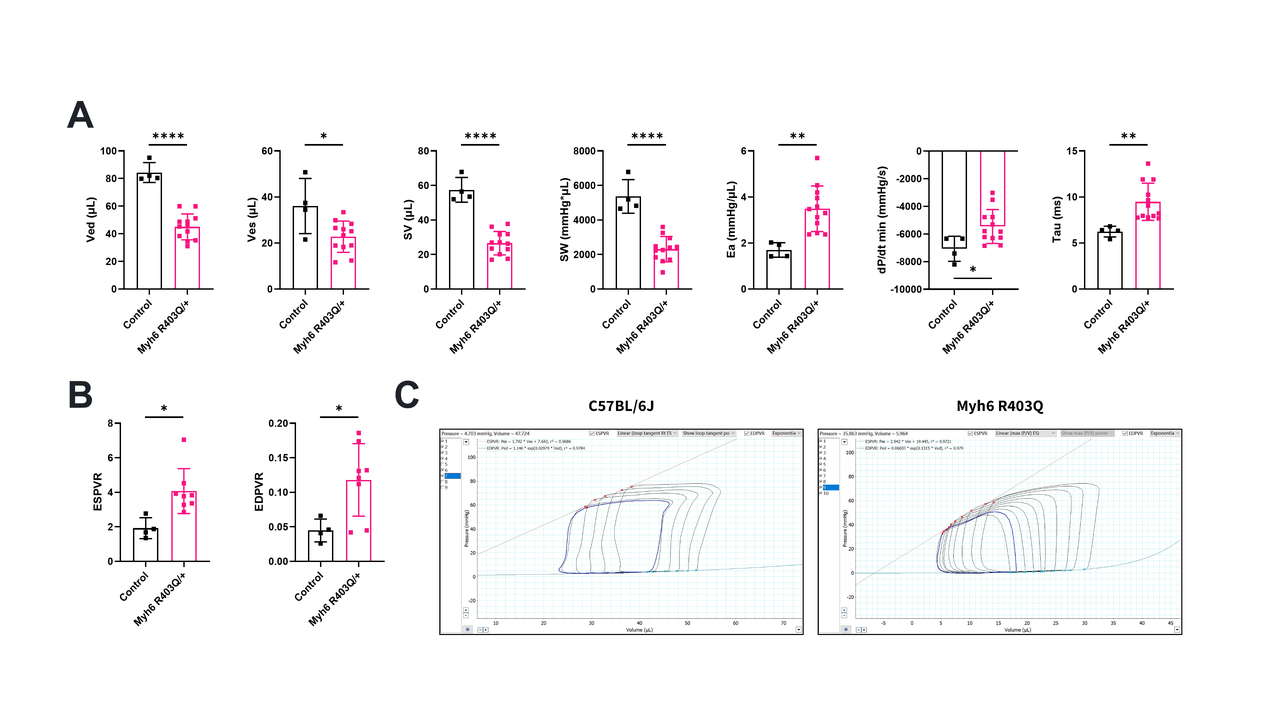 (A) Bar graphs: Mutants show ↑Ved, ↑Ves (dilation), ↑Tau (impaired relaxation) vs. Control. (B) Box plots: ↓ESPVR (reduced contractility), altered EDPVR (stiffness). (C) PV loops: Mutant loops are right-shifted and enlarged, confirming severe systolic dysfunction (****p<0.0001).
Myh6 R404Q+/- Hearts Show Fibrotic Pathology.
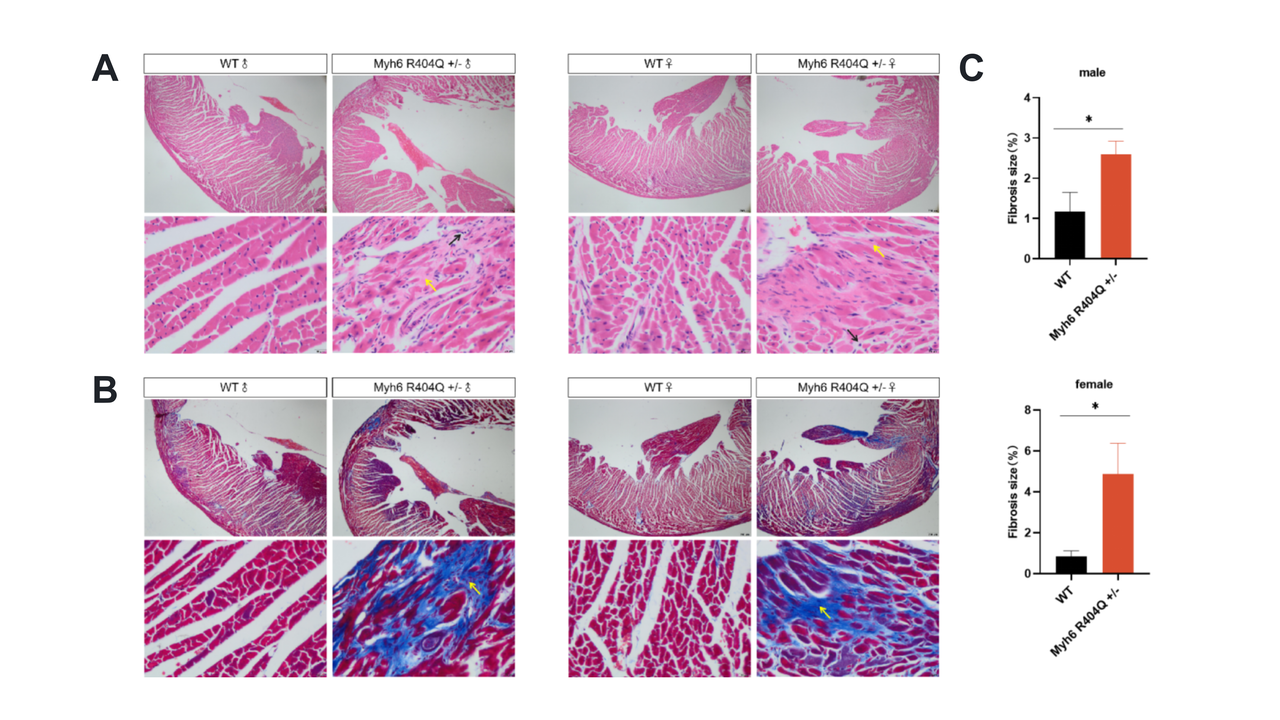
(A) H&E staining reveals tissue disruption (yellow arrows) in mutant hearts. (B) Masson’s trichrome staining highlights extensive collagen deposition (blue, yellow arrow) in mutants, especially females. (C) Fibrosis quantification confirms a significant increase (*p<0.05) in mutant mice (~2.5% in males, ~5% in females) versus WT (~1% males, ~0.5% females).
Mavacamten improves the HCM phenotype of the Myh6.pR404C mice
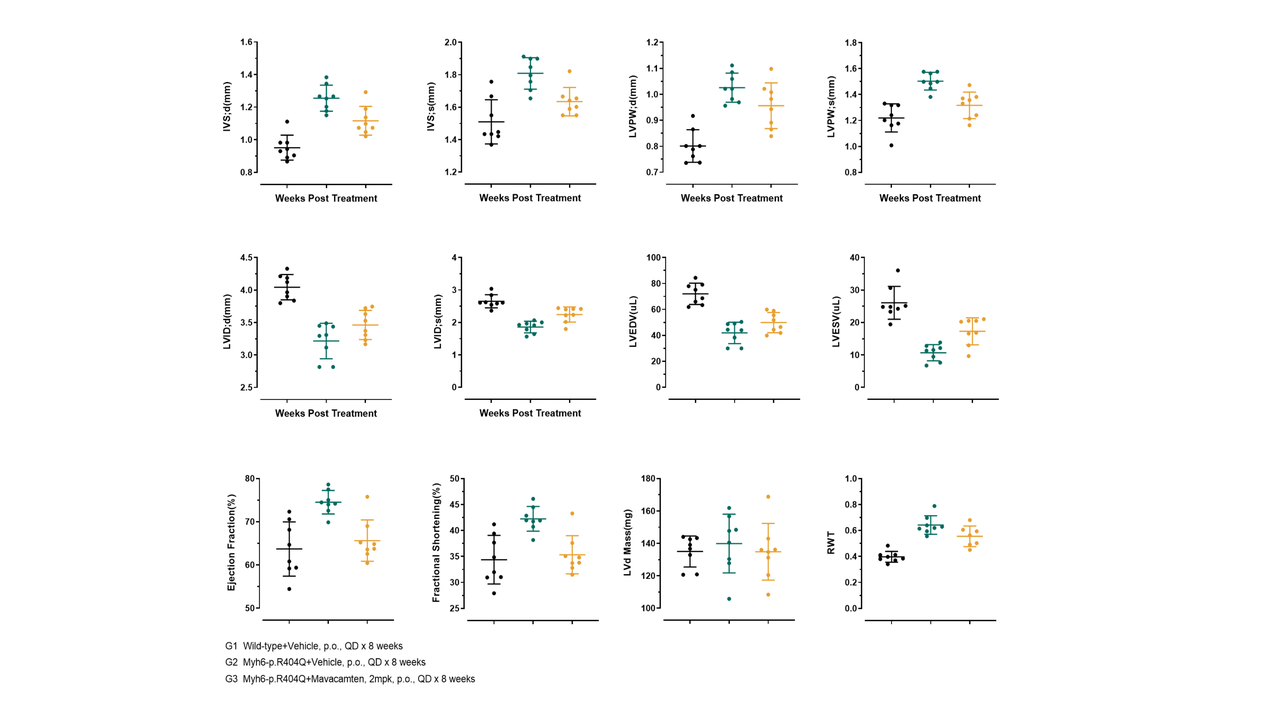 Echocardiographic parameters (IVS;d, LVID;s, LVPW;d, LVEDV, LVESV, EF, FS, LV Mass, RWT) were tracked from baseline to 8 weeks in three groups: G1 (WT+Vehicle), G2 (Myh6-p.R404Q+Vehicle), and G3 (Myh6-p.R404Q+Mavacamten, 2 mg/kg). Data points show mean±SEM.
All Product Lines
Browse our comprehensive catalog of over 30,000 mouse models covering various gene families, signaling pathways, and disease models. Use advanced filters to find the perfect model for your research.


- 1
- 2
- 3
- 4
- 5
- 6
- 9
Recommended for You
Discover related models and services to accelerate your research

Accelerate Your Research
Download



Newsletter Signup


We value your privacy
This website will store cookies on your computer. These cookies are used to collect information about how you interact with this website and enable us to remember you. We use this information to improve and customize your browsing experience, as well as to analyze and collect relevant data and metrics about visitors on this website and other platforms. For more information about the cookies we use, please refer to our privacy policy
If you decline, your information will not be tracked when visiting this website. A cookie will be used in your browser to remember your preference settings that you have not accepted.


Contact Us
Schedule a Meeting
Let us know which event you're attending and we'd be happy to connect with you.