


'/%3e%3c/svg%3e)

- By Indication
 Inflammatory and Autoimmune DiseasesRespiratory DiseasesInfectious DiseasesRare DiseaseGut Microbiota Research ServiceBy Modality
 From Bench to Bedside: Modeling Autoimmune, Genetic, and Fibrotic Kidney Diseases in Mice
 2026-09-22
 11:00 AM ET
 Dr. Yinlian ZhangStudy Director, Autoimmune Pipeline

'/%3e%3c/svg%3e)
'/%3e%3c/svg%3e)

Obesity
- 30+Obesity & Humanized Models
- 500+Studies Completed
- 30+IND-Enabling Studies
Our Advantages
Industry-leading capabilities for metabolic diseases research

GemPharmatech's Obesity Platform
Comprehensive capabilities for obesity and metabolic related research.
01
Diverse Model Portfolio
Readily available diet-induced, spontaneous obesisty, and humanized mouse and rat models supporting mechanistic and efficacy studies for next-generation weight-loss and muscle-preserving therapies
02
Integrated Phenotyping Platform
Quantitative NMR, DEXA, CLAMS, grip strength, in vivo imaging, exercise testing, and muscle/fat pathological quantification enable comprehensive efficacy assessment.
03
Customized End-to-End Services
We provide customized services including model construction, model validation, mechanism research and pharmacodynamic evaluation, supporting IND application of investigational drugs.
04
Model Library
Comprehensive metabolic diseases models for preclinical research

Case Studies & Validation Data
DIO Mouse Model
Phenotype of DIO Mouse Model


60% high-fat diet feeding robustly induced an obese and metabolically impaired phenotype in B6J mice, as shown by progressive body weight gain, increased fat mass and fat percentage, hyperleptinemia, elevated fasting blood glucose, hyperinsulinemia, impaired glucose tolerance, dyslipidemia, and increased serum ALT, indicating obesity-associated metabolic dysfunction and liver injury.
(A) Body weight changes during 60% HFD feeding. The left panel shows body weight change relative to week 0 (male ,age~6 wks) and the right panel shows absolute body weight from week 0 to week 10, demonstrating a progressive increase in body weight over time,(n=216); (B) Body composition analysis after 12 weeks of 60% HFD feeding, including lean mass, fat mass, and fat percentage. Compared with B6J+CD mice, B6J+60%HFD mice showed markedly increased fat mass and fat percentage, with a mild reduction in lean mass; (C) Serum leptin levels. B6J+60%HFD mice exhibited significantly elevated leptin levels, indicating adipose tissue expansion and hyperleptinemia; (D) Five-hour fasting blood glucose levels. B6J+60%HFD mice showed significantly increased fasting blood glucose, suggesting impaired basal glucose homeostasis; (E) Serum insulin levels. Insulin levels were significantly increased in B6J+60%HFD mice, indicating compensatory hyperinsulinemia; (F) Glucose tolerance test and 0–120 min area under the curve analysis. B6J+60%HFD mice maintained higher blood glucose levels after glucose challenge and showed a significantly increased AUC, indicating impaired glucose clearance; (G) Serum lipid profile, including total cholesterol, LDL-C, HDL-C, and triglycerides. B6J+60%HFD mice showed significantly increased total cholesterol, LDL-C, and HDL-C, whereas triglyceride levels were significantly reduced, indicating altered circulating lipid metabolism; (H) Serum ALT levels. ALT was significantly elevated in B6J+60%HFD mice, suggesting HFD-induced hepatocellular injury or hepatic metabolic stress. Groups were defined as B6J+CD and B6J+60%HFD. Data are presented as mean ± SEM. Each dot represents an individual mouse. Statistical significance is indicated in the figure: *, p < 0.05; ***, p < 0.001; and ****, p < 0.0001,by unpaired t test.
Weight-loss efficacy of Semaglutide and Bimagrumab in HFD-induced obese mice

Semaglutide lowered body weight in DIO mice by reducing both fat and lean mass, while Bimagrumab reduced fat mass and increased lean mass. Combined dosing preserved fat-loss efficacy and limited lean tissue loss, supporting a dual benefit in weight reduction and muscle preservation.
(A) Body weight changes during the dosing period; (B) body weight change rate relative to Day 0; (C) body weight change versus baseline on Day 13; (D) body weight change versus baseline on Day 27; (E) fat mass change versus baseline on Day 27; and (F) lean mass change versus baseline on Day 27. Groups were defined as follows: G1, CD + Vehicle; G2, DIO + Vehicle; G3, DIO + Semaglutide (30 nmol/kg, QD, s.c.); G4, DIO + Bimagrumab (20 mpk, QW, s.c.); and G5, DIO + Semaglutide (30 nmol/kg, QD, s.c.) + Bimagrumab (20 mpk, QW, s.c.). Data are presented as mean ± SEM. n=6~8. *, Statistical significance is indicated in the figure. *, p < 0.05; **, p < 0.01; ***, p < 0.001 and ****, p < 0.0001 by one way ANOVA.

Humanized GPCR Mouse Models
Weight-loss efficacy of Orforglipron in HFD-induced hGLP-1R mice

Orforglipron dose-dependently reduced acute food intake in B6-hGLP-1R mice. In HFD-induced obese hGLP-1R mice, repeated administration of Orforglipron or Semaglutide markedly reduced body weight gain and decreased fat mass, indicating that the body weight-lowering effect was mainly driven by fat loss, with relatively limited effects on lean mass.
(A) Schematic diagram of the acute food intake study. B6-hGLP-1R mice were fasted overnight, dosed at 9:00 a.m., and then refed. Cumulative food intake was recorded at 2, 4, 6, 8, and 24 h after dosing; (B) Cumulative food intake after acute Orforglipron administration. Gray bars indicate B6-hGLP-1R vehicle, green bars indicate B6-hGLP-1R Orforglipron 1 mpk, orange bars indicate B6-hGLP-1R Orforglipron 3 mpk, and blue bars indicate B6-hGLP-1R Orforglipron 10 mpk. Compared with the vehicle group, Orforglipron reduced cumulative food intake from 2 to 24 h after dosing, suggesting an appetite-suppressing effect; (C) Body weight changes during the repeated dosing period. Black indicates B6+CD+Vehicle, green indicates hGLP-1R+CD+Vehicle, orange indicates hGLP-1R+HFD+Vehicle, blue indicates hGLP-1R+HFD+Orforglipron at 1 mg/kg, and magenta indicates hGLP-1R+HFD+Semaglutide at 10 nmol/kg. HFD vehicle-treated mice maintained a high body weight, whereas Orforglipron- and Semaglutide-treated mice showed progressive body weight reduction; (D) Body weight change rate relative to Day 0. HFD vehicle-treated mice maintained a higher body weight change rate, while Orforglipron and Semaglutide induced marked negative body weight changes, indicating effective body weight reduction in obese mice; (E) Fat mass on Day 27 after dosing. HFD vehicle-treated mice showed markedly increased fat mass, whereas Orforglipron and Semaglutide significantly reduced fat mass, indicating that weight reduction was mainly associated with decreased adiposity; (F) Fat percentage on Day 27 after dosing. HFD vehicle-treated mice showed a high fat percentage, while Orforglipron and Semaglutide reduced fat percentage, further supporting improved HFD-induced fat accumulation; (G) Lean mass on Day 27 after dosing. Lean mass showed relatively modest differences among groups. HFD vehicle-treated mice displayed slightly higher lean mass, while Orforglipron- and Semaglutide-treated mice showed mild reductions or values close to the control groups; (H) Lean percentage on Day 27 after dosing. CD-fed mice showed a higher lean percentage, whereas HFD vehicle-treated mice showed a reduced lean percentage. Orforglipron and Semaglutide partially restored lean percentage relative to HFD vehicle-treated mice, suggesting relative preservation of lean tissue proportion during fat mass reduction. Data are presented as mean ± SEM. Statistical significance is indicated in the figure: *, p < 0.05; **, p < 0.01; ***, p < 0.001; and ****, p < 0.0001.
Pharmacological Validation of Human GIPR Signaling in B6-hGIPR Mice
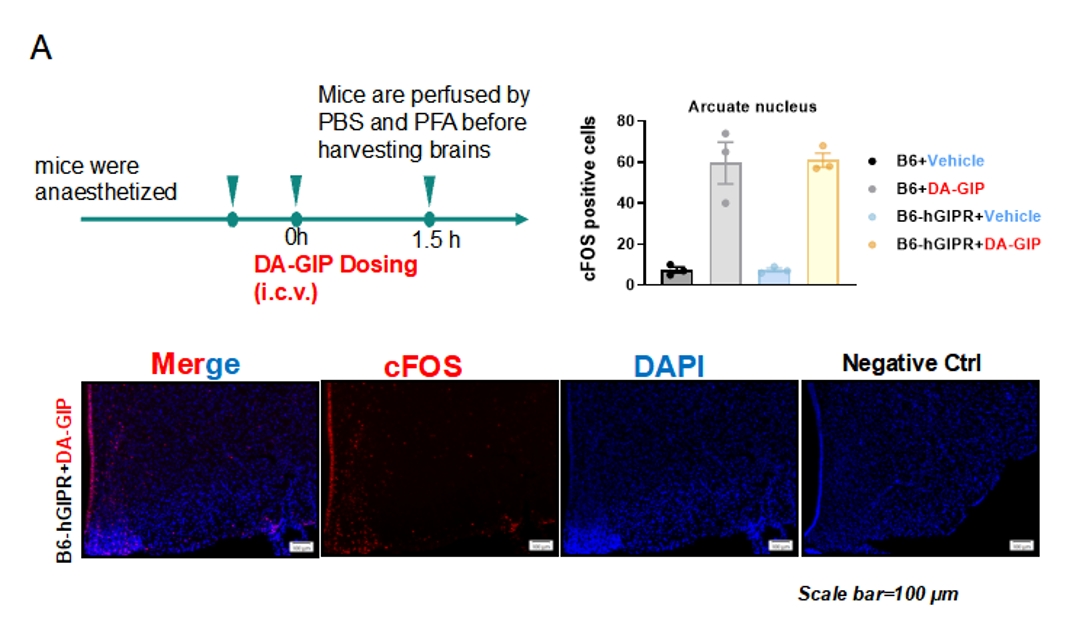
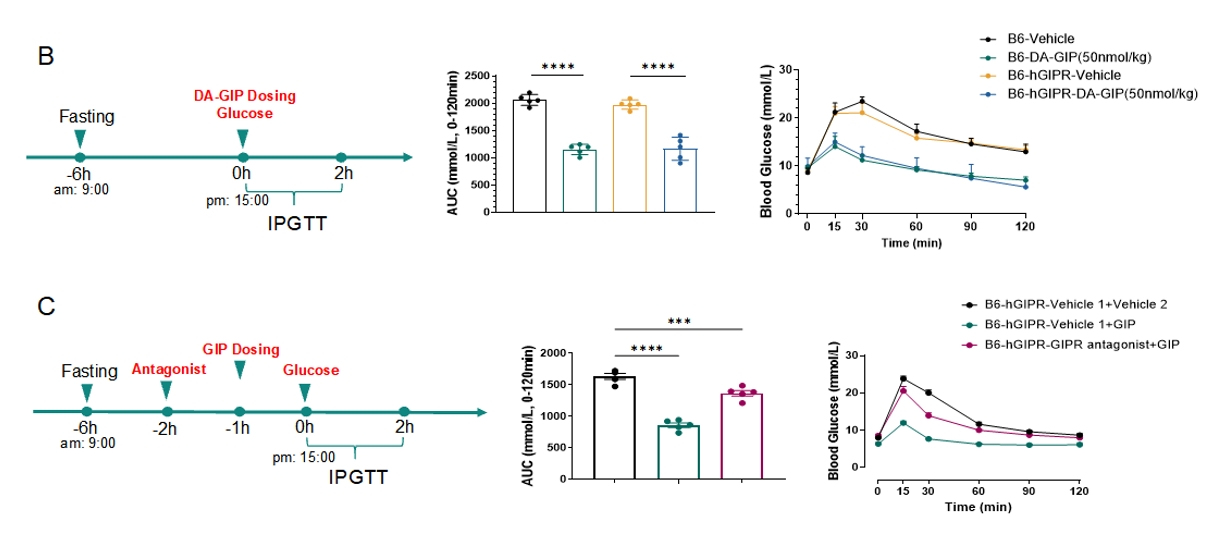
Intracerebroventricular DA-GIP induced c-Fos activation in the hypothalamic arcuate nucleus of B6-hGIPR mice at a level comparable to that of B6 mice. DA-GIP markedly reduced blood glucose excursion and AUC during IPGTT in both strains, indicating that human GIPR retains central and metabolic pharmacology comparable to the mouse receptor. In B6-hGIPR mice, the glucose-lowering effect of GIP was abolished by GIPR antagonist pretreatment, confirming receptor-specific, human GIPR-dependent pharmacology in the humanized model.
(A) Schematic of the acute intracerebroventricular (i.c.v.) dosing study and hypothalamic analysis. B6 and B6-hGIPR mice were anesthetized, dosed with vehicle or DA-GIP by i.c.v. injection at 0 h, and perfused with PBS and PFA 1.5 h later for c-Fos immunofluorescence. Representative merged, c-Fos, DAPI and negative-control images of the hypothalamic arcuate nucleus from the B6-hGIPR DA-GIP-treated group are shown; scale bar, 100 µm. DA-GIP markedly increased the number of c-Fos-positive cells in both B6 and B6-hGIPR mice compared with vehicle, with comparable activation levels between the two genotypes, indicating that DA-GIP activates arcuate nucleus neurons through the human GIPR; (B) Schematic and outcomes of the acute IPGTT study. B6 and B6-hGIPR mice were fasted from 9:00 a.m. and received vehicle or DA-GIP (50 nmol/kg) together with the glucose challenge at 15:00, followed by a 2-h IPGTT. Compared with vehicle, DA-GIP significantly reduced glucose AUC from 0 to 120 min and lowered blood glucose excursion during the IPGTT in both B6 and B6-hGIPR mice, indicating improved glucose tolerance through the human GIPR; (C) Receptor-dependence IPGTT in male B6-hGIPR mice. Fasted mice were pretreated with vehicle or a GIPR antagonist (6 mg/kg, p.o.), followed by GIP (5 nmol/kg, s.c.) administration and glucose challenge. GIP significantly reduced glucose AUC and blood glucose excursion relative to vehicle, whereas GIPR antagonist pretreatment abolished GIP-mediated glucose lowering, returning AUC and glucose excursion close to vehicle levels, indicating that the glucose-lowering effect of GIP depends on GIPR activation in the humanized mice. Data are presented as mean ± SEM. Statistical significance is indicated in the figure: *, p < 0.05; **, p < 0.01; ***, p < 0.001; and ****, p < 0.0001.
Integrated Metabolic Efficacy of Orforglipron Plus a GIPR Antagonist in Dual-humanized hGLP-1R/hGIPR DIO Mice
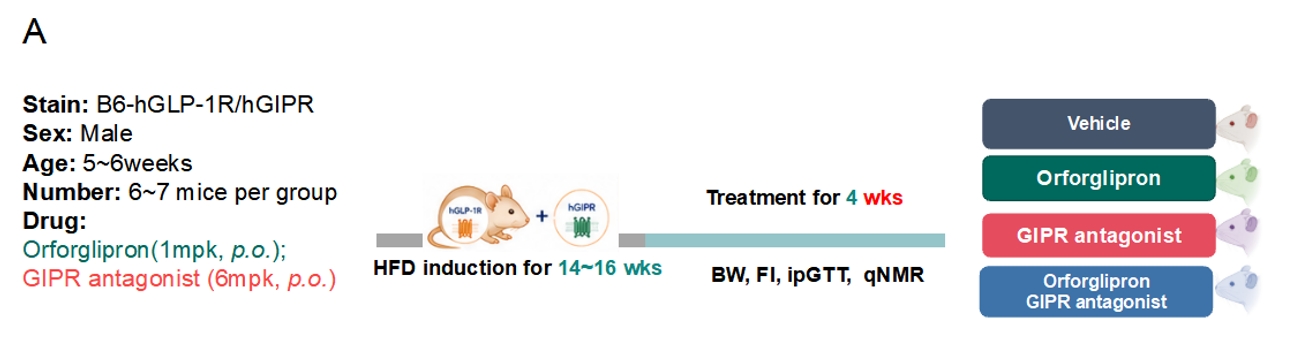
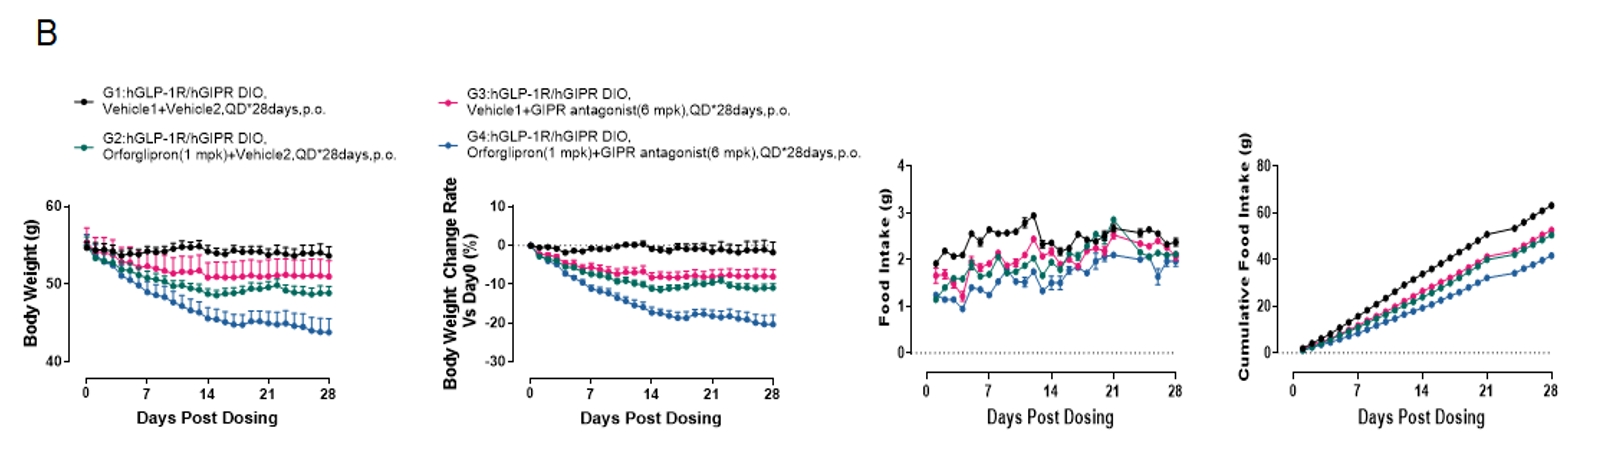
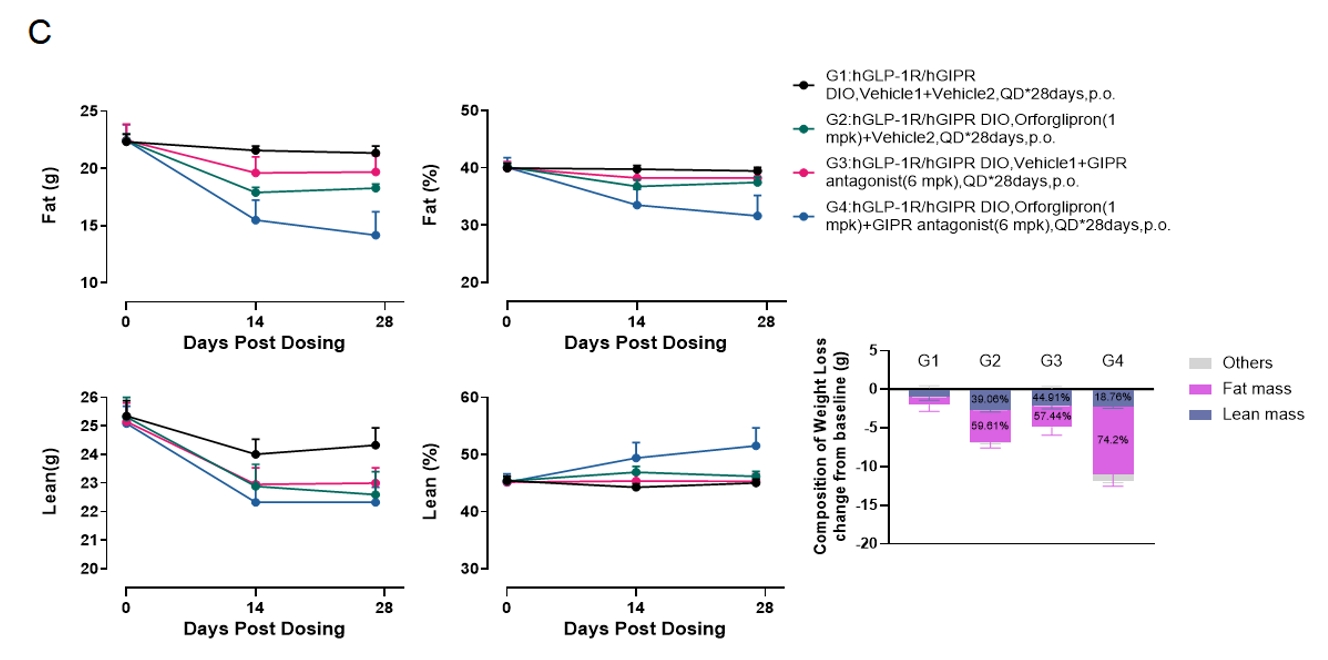
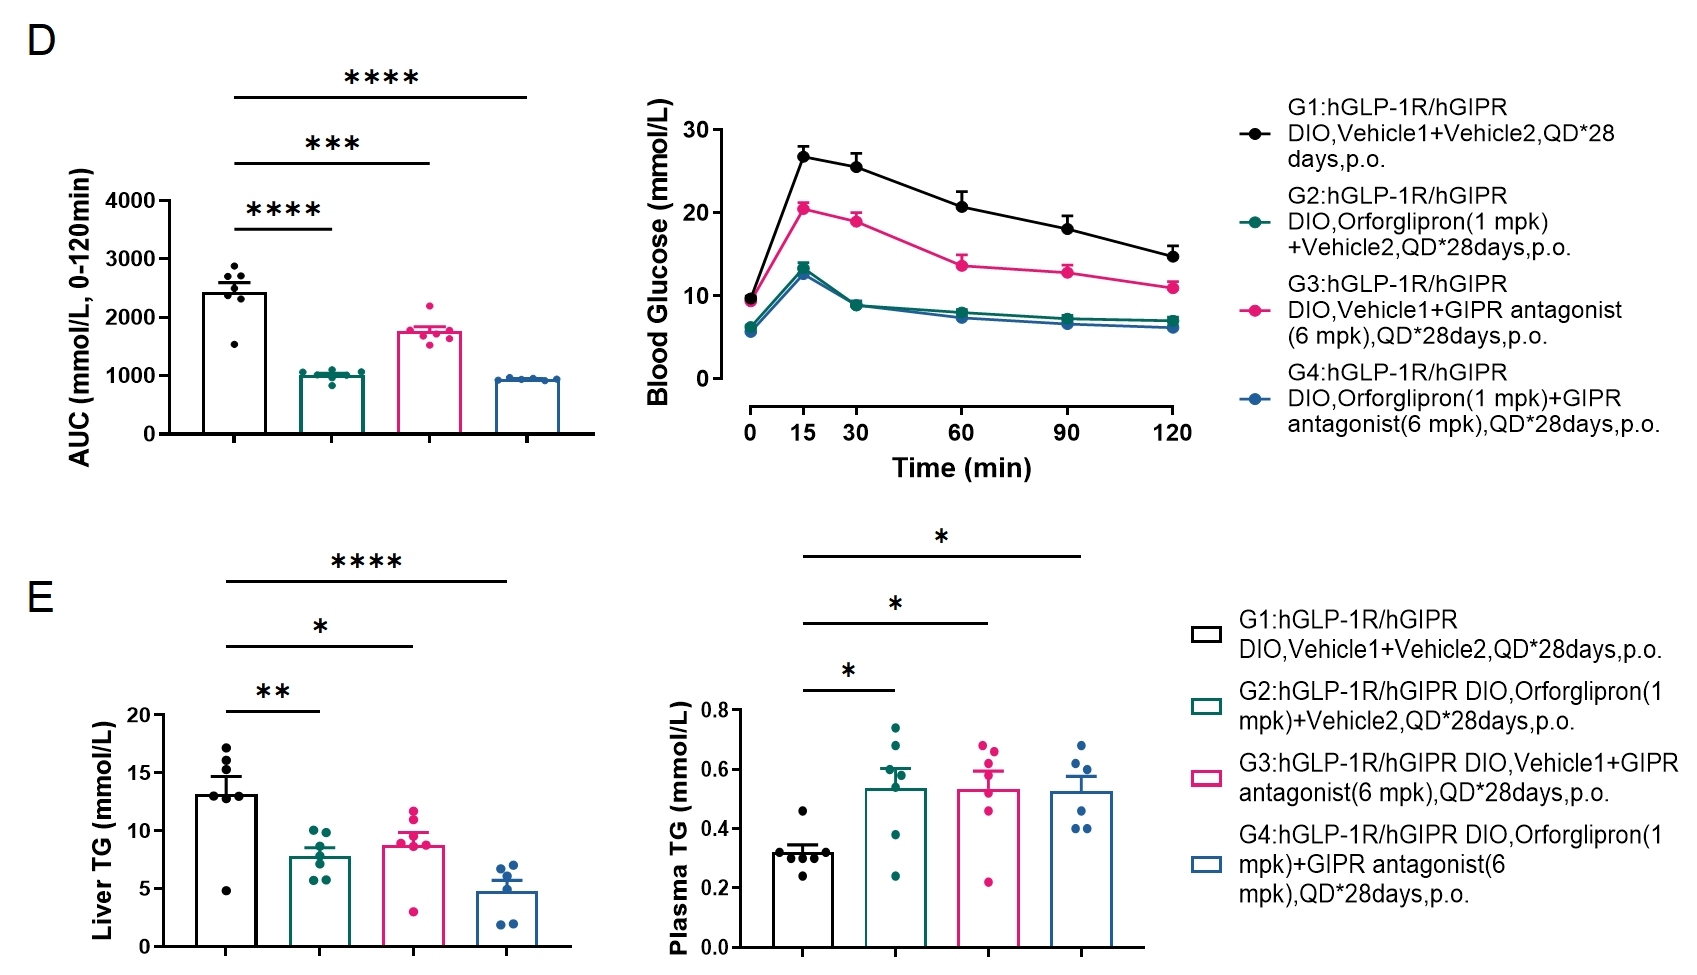
In HFD-induced obese B6-hGLP-1R/hGIPR mice, once-daily oral Orforglipron reduced food intake and body weight, and co-administration of a GIPR antagonist further enhanced these effects, with the combination reducing body weight by approximately 18% after 28 days of treatment. Combination-driven weight loss was mainly driven by fat loss, with relatively limited effects on lean mass, and was accompanied by improved glucose tolerance and reduced hepatic triglycerides.
(A) Schematic of the study design. Male B6-hGLP-1R/hGIPR mice (5–6 weeks old at enrollment; n = 6–7/group) were fed a high-fat diet for 14–16 weeks to induce obesity, followed by 28 days of once-daily oral treatment with vehicle, Orforglipron (1 mg/kg), a GIPR antagonist (6 mg/kg), or the combination; body weight, food intake, glucose tolerance and qNMR body composition were monitored throughout the study; (B) Body weight, body weight change rate relative to Day 0, daily food intake and cumulative food intake during the 28-day treatment period. Vehicle-treated DIO mice maintained a high and stable body weight, whereas Orforglipron or GIPR antagonist monotherapy produced moderate reductions in body weight and food intake; the combination produced the greatest effect, reducing body weight by approximately 18% and lowering daily and cumulative food intake to the lowest levels among all groups, indicating complementary efficacy of GLP-1R agonism and GIPR antagonism on body weight control; (C) Longitudinal qNMR body composition measured at baseline and Days 14 and 28, including fat mass, fat percentage, lean mass and lean percentage, and composition of body weight loss relative to baseline. Vehicle-treated mice maintained high fat mass and fat percentage throughout the study, whereas all treated groups showed reductions; the combination produced the greatest reductions in fat mass and fat percentage and the highest lean percentage at Day 28. Composition analysis showed that fat loss accounted for 74.2% of the total body weight reduction in the combination group, compared with 59.61% in the Orforglipron group and 57.44% in the GIPR antagonist group, indicating that combination-driven weight loss was mainly fat-mass driven with relative preservation of lean tissue proportion; (D) Glucose AUC from 0–120 min and blood glucose curves during the IPGTT. Vehicle-treated mice showed the highest AUC and glucose excursion; Orforglipron alone and the combination markedly reduced AUC and glucose excursion, and the GIPR antagonist alone produced an intermediate improvement, indicating improved glucose tolerance in the treated groups; (E) Hepatic and plasma triglyceride levels at the end of the study. All treated groups showed lower hepatic triglyceride levels than vehicle, with the combination producing the lowest hepatic triglyceride levels; plasma triglycerides were higher in all treated groups than in vehicle. Data are presented as mean ± SEM. Statistical significance is indicated in the figure: *, p < 0.05; **, p < 0.01; ***, p < 0.001; and ****, p < 0.0001.
Humanized ACVR1C Mouse Models
Evaluation of ALK7/ACVR1C siRNA and TZP in B6-hACVR1C Humanized Mice

siRNAs targeting ALK7/ACVR1C effectively reduced hACVR1C mRNA expression in inguinal white adipose tissue of B6-hACVR1C mice and attenuated body weight gain in HFD-fed obese mice. In the repeated dosing study, siRNA-ALK7 alone showed limited effects on body weight and body composition, whereas TZP and siRNA-ALK7 combined with TZP markedly reduced body weight, fat mass, and fat percentage while increasing lean mass percentage, indicating that the weight-lowering effect was mainly driven by fat loss.
(A) hACVR1C mRNA levels in inguinal white adipose tissue. Compared with B6-hACVR1C vehicle-treated mice, Arrowhead siRNA and Alnylam siRNA significantly reduced hACVR1C mRNA expression, showing approximately 51% and 76% knockdown efficiency, respectively, indicating effective suppression of adipose hACVR1C expression; (B) Effects of Alnylam siRNA on body weight in HFD-fed B6-hACVR1C mice. The left panel shows body weight from Day 0 to Day 49 after dosing, and the right panel shows body weight change rate relative to Day 0. Compared with the vehicle group, Alnylam siRNA slowed body weight gain and reduced the body weight change rate by Day 49, suggesting that hACVR1C inhibition partially limits HFD-induced weight gain; (C) Body weight and body weight change rate during the 28-day repeated dosing period. Vehicle- and siRNA-ALK7-treated mice maintained or slightly increased body weight, whereas TZP and the combination treatment induced rapid and sustained body weight reduction; (D) Daily food intake and cumulative food intake during dosing. Vehicle and siRNA-ALK7 alone maintained relatively high daily food intake with continuously increasing cumulative intake. (E) Fat mass at the study endpoint. Vehicle and siRNA-ALK7 alone showed high fat mass with no obvious difference between groups, whereas TZP and the combination treatment significantly reduced fat mass, indicating that body weight reduction was primarily driven by adipose tissue loss; (F) Fat percentage at the study endpoint. Vehicle and siRNA-ALK7 alone showed high fat percentage, while TZP and the combination treatment markedly reduced fat percentage, further demonstrating improved adiposity in obese mice; (G) Lean mass at the study endpoint. Absolute lean mass was lower in the TZP and combination groups than in the vehicle and siRNA-ALK7 groups, suggesting some lean mass reduction during pronounced body weight loss; (H) Lean mass percentage at the study endpoint. Vehicle and siRNA-ALK7 alone showed lower lean percentage, whereas TZP and the combination treatment significantly increased lean percentage, indicating an overall shift toward lower adiposity and a higher proportion of lean tissue. Data are presented as mean ± SEM. Statistical significance is indicated in the figure: ns, not significant; **, p < 0.01; ***, p < 0.001; and ****, p < 0.0001
DIO Rat Model
Phenotype of DIO Rat Model

60% high-fat diet feeding robustly induced obesity and metabolic dysfunction in rats, as evidenced by progressive body weight gain, increased fat ratio, elevated serum leptin and insulin levels, impaired glucose tolerance, and altered serum lipid profiles, including reduced TG and increased TC, LDL-C, and HDL-C levels. These findings indicate a typical HFD-induced obese phenotype with glucose and lipid metabolic disturbances.
(A) Body weight changes during the 60% HFD feeding period. Compared with the G1 CD group, rats in the G2 60%HFD group showed increased body weight from the early feeding period, with sustained and significant elevation from week 4 to week 20; (B) Fat ratio after 12 weeks of feeding. G2 60%HFD rats showed a significantly higher fat ratio than G1 CD rats, indicating marked adipose accumulation; (C) Serum leptin levels. Leptin was significantly increased in G2 60%HFD rats, suggesting adipose tissue expansion and hyperleptinemia; (D) Oral glucose tolerance test (OGTT) and 0–120 min area under the curve analysis. G2 60%HFD rats displayed higher blood glucose levels after glucose challenge and a significantly increased AUC, indicating impaired glucose clearance and glucose intolerance; (E) Serum insulin levels. Insulin was ignificantly elevated in G2 60%HFD rats, indicating compensatory hyperinsulinemia induced by HFD feeding; (F) Serum triglyceride (TG) levels. Compared with G1 CD rats, G2 60%HFD rats showed reduced TG levels at multiple time points; (G) Serum total cholesterol (TC) levels. TC levels were increased in G2 60%HFD rats at weeks 8, 10, 12, and 14; (H) Serum low-density lipoprotein cholesterol (LDL-C) levels. G2 60%HFD rats showed an overall increase in LDL-C, suggesting altered atherogenic lipid metabolism; (I) Serum high-density lipoprotein cholesterol (HDL-C) levels. HDL-C levels were significantly increased in G2 60%HFD rats at weeks 10, 12, and 14, indicating marked changes in circulating lipoprotein composition. Groups were defined as follows: G1, CD; G2, 60%HFD. Data are presented as mean ± SEM. Each dot represents an individual rat. Statistical significance is indicated in the figure: *, p < 0.05; **, p < 0.01; ***, p < 0.001; and ****, p < 0.0001.
Weight-loss efficacy of Cagrilintide and Eloralintide in HFD-induced obese rats

In DIO rats, both Cagrilintide and Eloralintide significantly reduced body weight and food intake. Cagrilintide decreased both fat and lean mass, whereas Eloralintide mainly reduced fat mass, highlighting differentiated body-composition outcomes for amylin-based therapies.
(A) Daily food intake after dosing; (B) body weight change rate relative to Day 0; and (C) contribution of lean mass and fat mass to body weight change from Day 28 to Day 0. Groups included DIO Vehicle, DIO Cagrilintide (10 nmol/kg, q2d, s.c.), and DIO Eloralintide (10 nmol/kg, q2d, s.c.). Both treatments reduced body weight and transiently suppressed food intake in DIO rats, with cagrilintide showing a greater weight-loss effect. Body composition analysis indicated that the weight reduction was mainly driven by fat mass loss, while cagrilintide was also associated with a more pronounced reduction in lean mass. n=6~8.Data are presented as mean ± SEM.*, p < 0.05; **, p < 0.01; ***, p < 0.001 and ****, p < 0.0001 by one way ANOVA.
B6-ob Model
Phenotype of B6-ob Mouse Model

ob mice spontaneously developed an obese phenotype, as shown by progressive body weight gain, significantly increased terminal body weight and fat mass, and no obvious increase in lean mass. In addition, random blood glucose and fasting blood glucose changed dynamically during the observation period, suggesting that spontaneous obesity in ob mice was accompanied by impaired glucose metabolism.
(A) Longitudinal body weight changes in ob mice. The red line indicates a progressive increase in body weight over time, demonstrating spontaneous and sustained weight gain in this model;(B) Terminal body composition analysis, including body weight, fat mass, and lean mass. Black circles indicate the control group, and red triangles indicate the ob group. Compared with control mice, ob mice showed significantly increased body weight and fat mass, whereas lean mass was not obviously changed, indicating that body weight gain was mainly driven by adipose tissue accumulation(C) Random blood glucose (RGB) levels during the observation period. RGB showed dynamic fluctuations across different time points, indicating changes in non-fasting glucose levels during spontaneous obesity development;(D) Fasting blood glucose (FGB) levels during the observation period. FGB showed stage-dependent changes, suggesting altered fasting glucose metabolism in spontaneously obese ob mice. Data are presented as mean ± SEM. Each dot represents an individual mouse. Statistical significance is indicated in the figure: ***, p < 0.001.
B6-Alms1-del Model
Phenotype of B6-Alms-del Mouse Model

ALMS1 spontaneous mutant mice progressively developed obesity and metabolic abnormalities with age, as shown by increased body weight, fat percentage, food intake, plasma cholesterol, HDL-C, LDL-C, and postprandial blood glucose, together with impaired glucose tolerance. These findings support this model for studies of obesity-associated glucose and lipid metabolic disorders.
(A) Body weight changes. Compared with B6 control mice, ALMS1 spontaneous mutant mice showed progressive body weight gain with age, indicating spontaneous development of obesity; (B) Fat percentage. ALMS1 spontaneous mutant mice showed markedly higher fat percentage than B6 control mice at 8, 12, and 16 weeks of age, suggesting increased adiposity; (C) Food intake. Food intake was generally higher in ALMS1 spontaneous mutant mice than in B6 control mice, suggesting that increased food consumption may contribute to the obese phenotype; (D) Plasma total cholesterol levels. Plasma Chol levels increased with age and were significantly higher in ALMS1 spontaneous mutant mice than in B6 controls; (E) Plasma HDL-C levels. HDL-C levels were elevated in ALMS1 spontaneous mutant mice, indicating altered lipoprotein metabolism; (F) Plasma LDL-C levels. LDL-C levels were increased in ALMS1 spontaneous mutant mice compared with B6 controls, suggesting marked dyslipidemia; (G) Plasma triglyceride levels. TG levels showed an age-dependent decreasing trend in ALMS1 spontaneous mutant mice, reflecting dynamic changes in lipid metabolism; (H) Blood glucose curve during the glucose tolerance test. ALMS1 spontaneous mutant mice showed delayed glucose clearance after glucose challenge, indicating impaired glucose tolerance; (I) Area under the curve from 0 to 120 min. AUC was significantly increased in ALMS1 spontaneous mutant mice, further confirming impaired glucose tolerance; (J) Postprandial blood glucose levels. ALMS1 spontaneous mutant mice showed significantly higher postprandial blood glucose at multiple ages, indicating persistent glucose metabolic dysfunction. Black circles indicate B6 male mice, and red triangles indicate B6-Alms1-del male spontaneous mutant mice. Data are presented as mean ± SEM. Statistical significance is indicated in the figure: *, p < 0.05; **, p < 0.01; ***, p < 0.001; and ****, p < 0.0001.
B6-Chr1 YP1 Model
Phenotype of B6-Chr1 YP1 Mouse Model

Chromosome 1 replacement wild-type mice developed a spontaneous obese and metabolically abnormal phenotype, characterized by progressive body weight gain, increased plasma total cholesterol, elevated food intake, reduced nocturnal locomotor activity, enlarged pale liver, hepatic steatosis, and increased hepatic lipid accumulation.
(A) Body weight changes. Compared with B6J male mice, B6-Chr1^YP1 male mice showed increased body weight from an early age and progressive weight gain over time, indicating spontaneous obesity; (B) Plasma total cholesterol levels. CHOL levels were significantly increased in B6-Chr1^YP1 male mice at 13 and 16 weeks of age compared with B6J controls, suggesting cholesterol metabolic dysregulation; (C) Food intake. B6-Chr1^YP1 male mice showed higher food intake than B6J controls at multiple ages, indicating that increased food consumption may contribute to the obese phenotype; (D) Spontaneous locomotor activity at 8 weeks of age. Compared with B6J mice, B6-Chr1^YP1 male mice showed markedly reduced X-ambulatory activity during the dark phase, suggesting impaired spontaneous activity; (E) Gross liver morphology. D000750 mice showed enlarged and paler livers compared with B6J mice, suggesting increased hepatic lipid accumulation. Scale bar: 1 cm; (F) Liver histology. H&E staining showed prominent vacuolar steatosis in D000750 mice, and Oil Red O staining revealed markedly increased neutral lipid deposition, indicating a fatty liver phenotype. Black circles indicate B6J male mice, and red squares indicate B6-Chr1^YP1 male mice. Data are presented as mean ± SEM. Statistical significance is indicated in the figure: **, p < 0.01; ***, p < 0.001; and ****, p < 0.0001.
Product Lines


- 1
- 2
Recommended for You
Discover related models and services to accelerate your research

Accelerate Your Research


'%3e%3cpath%20d='M13.6882%2012L23.6426%202.06059C23.8678%201.83321%2023.9941%201.52611%2023.9941%201.20607C23.9941%200.886035%2023.8678%200.578937%2023.6426%200.351553C23.4152%200.126341%2023.1081%200%2022.7881%200C22.468%200%2022.1609%200.126341%2021.9335%200.351553L11.9941%2010.306L2.05473%200.351553C1.82735%200.126341%201.52025%200%201.20021%200C0.880175%200%200.573077%200.126341%200.345693%200.351553C0.120482%200.578937%20-0.00585938%200.886035%20-0.00585938%201.20607C-0.00585937%201.52611%200.120482%201.83321%200.345693%202.06059L10.3001%2012L0.345693%2021.9394C0.120482%2022.1668%20-0.00585937%2022.4739%20-0.00585938%2022.7939C-0.00585938%2023.114%200.120482%2023.4211%200.345693%2023.6484C0.573077%2023.8737%200.880175%2024%201.20021%2024C1.52025%2024%201.82735%2023.8737%202.05473%2023.6484L11.9941%2013.694L21.9335%2023.6484C22.1666%2023.8397%2022.4624%2023.9374%2022.7635%2023.9226C23.0646%2023.9079%2023.3494%2023.7816%2023.5626%2023.5684C23.7757%2023.3553%2023.902%2023.0704%2023.9168%2022.7694C23.9316%2022.4683%2023.8338%2022.1724%2023.6426%2021.9394L13.6882%2012Z'%20fill='black'%20fill-opacity='0.96'/%3e%3c/g%3e%3cdefs%3e%3cclipPath%20id='clip0_2458_12695'%3e%3crect%20width='24'%20height='24'%20fill='white'/%3e%3c/clipPath%3e%3c/defs%3e%3c/svg%3e)
Submit Inquiry
Contact Us
Schedule a Meeting
Let us know which event you're attending and we'd be happy to connect with you.
Download
Download
Watch On-Demand Webinar
Newsletter Signup
'%3e%3cpath%20d='M13.6882%2012L23.6426%202.06059C23.8678%201.83321%2023.9941%201.52611%2023.9941%201.20607C23.9941%200.886035%2023.8678%200.578937%2023.6426%200.351553C23.4152%200.126341%2023.1081%200%2022.7881%200C22.468%200%2022.1609%200.126341%2021.9335%200.351553L11.9941%2010.306L2.05473%200.351553C1.82735%200.126341%201.52025%200%201.20021%200C0.880175%200%200.573077%200.126341%200.345693%200.351553C0.120482%200.578937%20-0.00585938%200.886035%20-0.00585938%201.20607C-0.00585937%201.52611%200.120482%201.83321%200.345693%202.06059L10.3001%2012L0.345693%2021.9394C0.120482%2022.1668%20-0.00585937%2022.4739%20-0.00585938%2022.7939C-0.00585938%2023.114%200.120482%2023.4211%200.345693%2023.6484C0.573077%2023.8737%200.880175%2024%201.20021%2024C1.52025%2024%201.82735%2023.8737%202.05473%2023.6484L11.9941%2013.694L21.9335%2023.6484C22.1666%2023.8397%2022.4624%2023.9374%2022.7635%2023.9226C23.0646%2023.9079%2023.3494%2023.7816%2023.5626%2023.5684C23.7757%2023.3553%2023.902%2023.0704%2023.9168%2022.7694C23.9316%2022.4683%2023.8338%2022.1724%2023.6426%2021.9394L13.6882%2012Z'%20fill='%23008077'%20fill-opacity='0.96'/%3e%3c/g%3e%3cdefs%3e%3cclipPath%20id='clip0_2458_12695'%3e%3crect%20width='24'%20height='24'%20fill='white'/%3e%3c/clipPath%3e%3c/defs%3e%3c/svg%3e)
We value your privacy
This website will store cookies on your computer. These cookies are used to collect information about how you interact with this website and enable us to remember you. We use this information to improve and customize your browsing experience, as well as to analyze and collect relevant data and metrics about visitors on this website and other platforms. For more information about the cookies we use, please refer to our privacy policy
If you decline, your information will not be tracked when visiting this website. A cookie will be used in your browser to remember your preference settings that you have not accepted.

