

Vitiligo Models
Vitiligo is an autoimmune skin disease characterized by depigmented skin as a result of melanocyte loss. Additional clinical features of vitiligo include patchy loss of skin color, premature whitening of the hair, and loss of color in the tissues (mouth and nose). The exact cause of vitiligo remains unknown, but some possible factors include genetic causes and environmental triggers that results in autoreactive CD8+ T cells that target melanocytes . The disease is maintained by melanocyte-reactive resident memory T cells (Trm) cells through an IL-15 dependent signaling pathway.
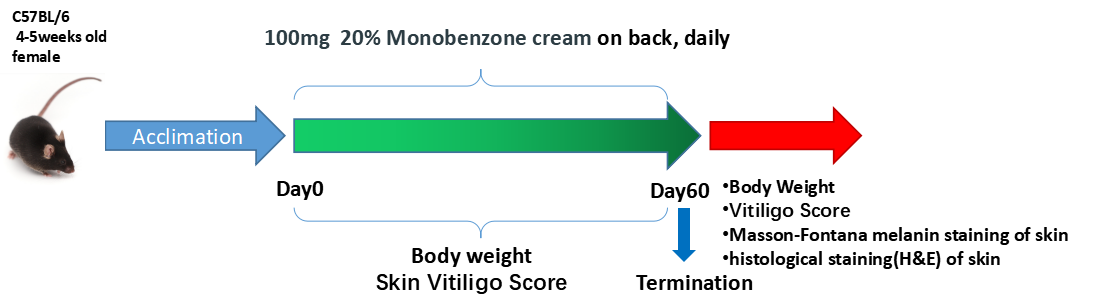
1. Monobenzone-induced vitiligo model
Model strategy and features of Monobenzone-induced vitiligo model
Phenotypic manifestations of Monobenzone-induced vitiligo model
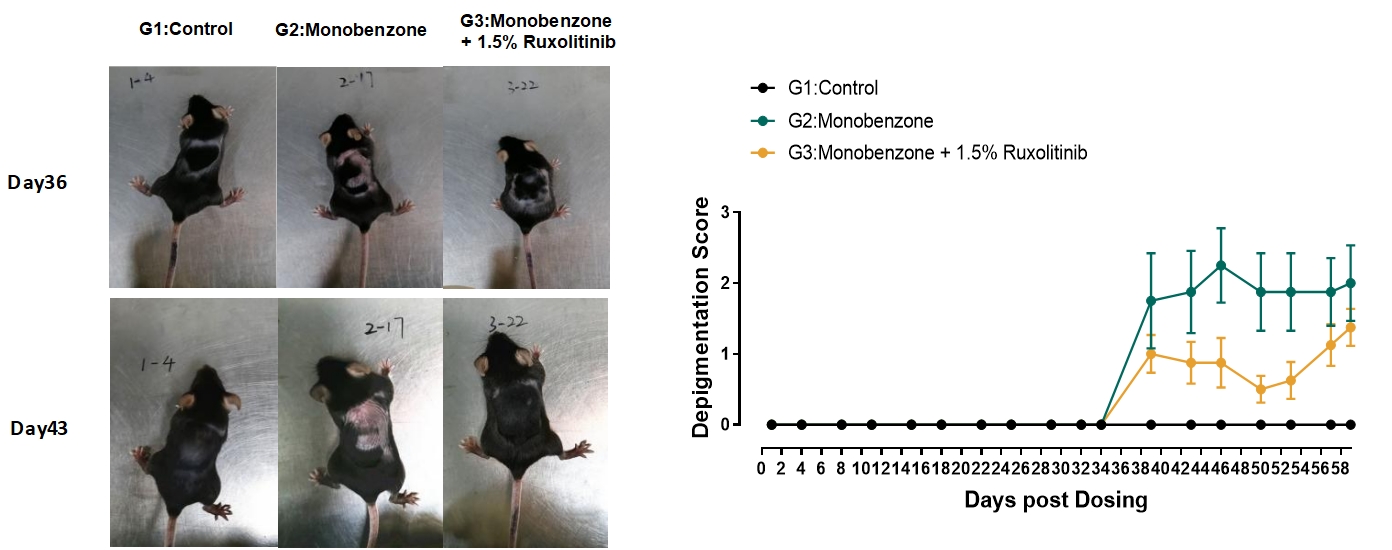
Ruxolitinib treatment was effective in treating depigmentation in animals induced by Monobenzone treatment .
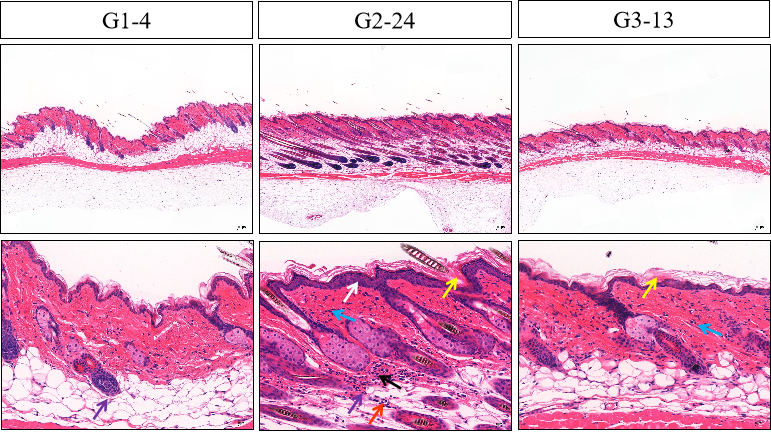
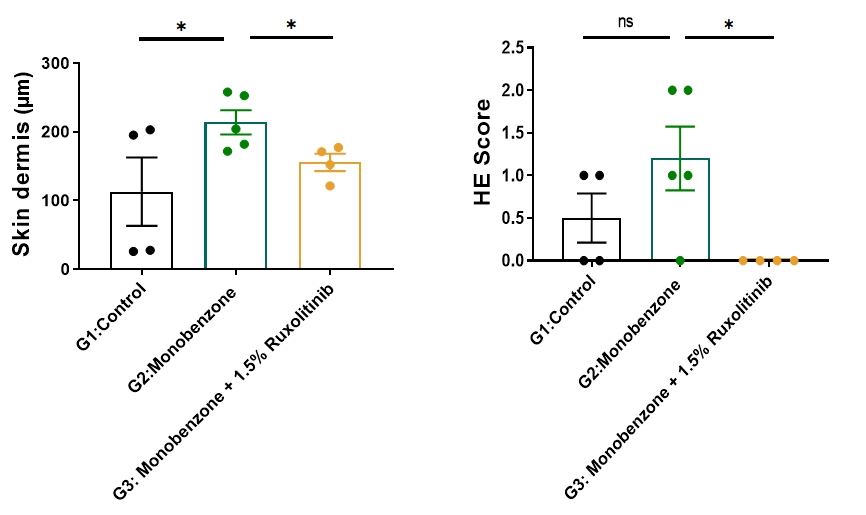
Skin HE
Representative H&E stains of each treatment group. G1: Control group; G2: Monobenzone induction group; G3: Monobenzone + 1.5% Ruxolitinib treatment group. Fibrous tissue hyperplasia (blue arrows), neutrophils (purple arrows), epidermal thickening (white arrows), punctate necrosis of the dermis (black arrows), lymphocytes (red arrows), hyperkeratosis (yellow arrows).
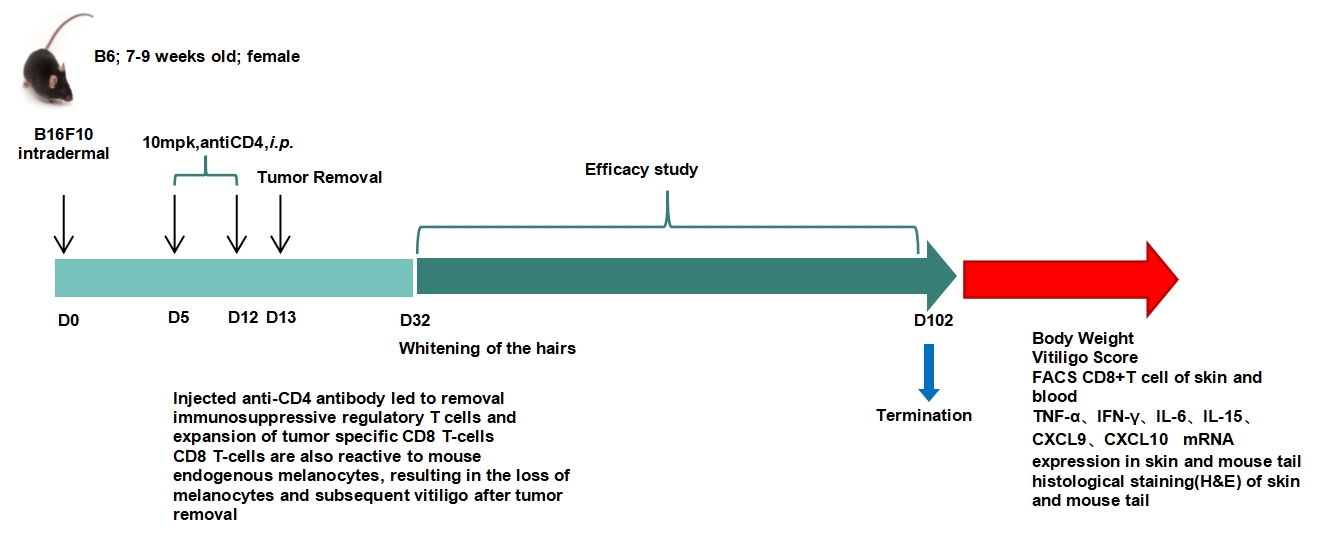
2. B16 melanoma tumor-induced autoreactive vitiligo model
Model strategy and features of B16 melanoma tumor-induced autoreactive vitiligo model
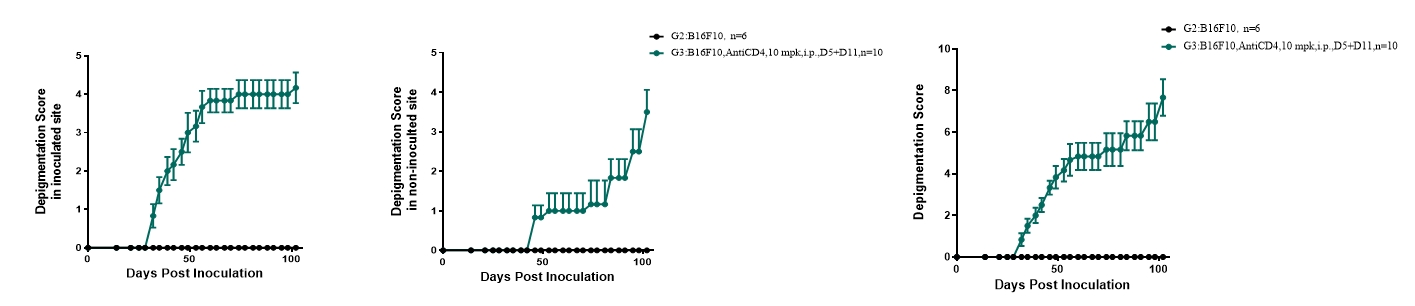
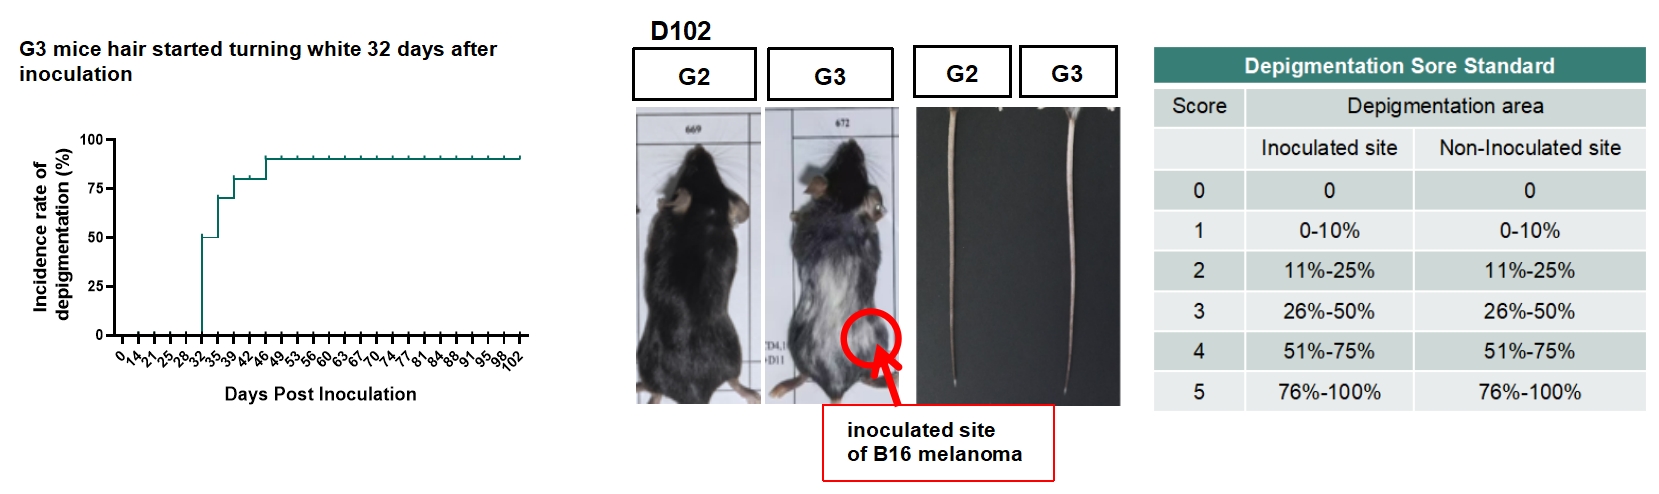
Depigmentation score and incidence rate increased in treated mice. G2: Control group; G3: B16 melanoma-induced autoreactive vitiligo
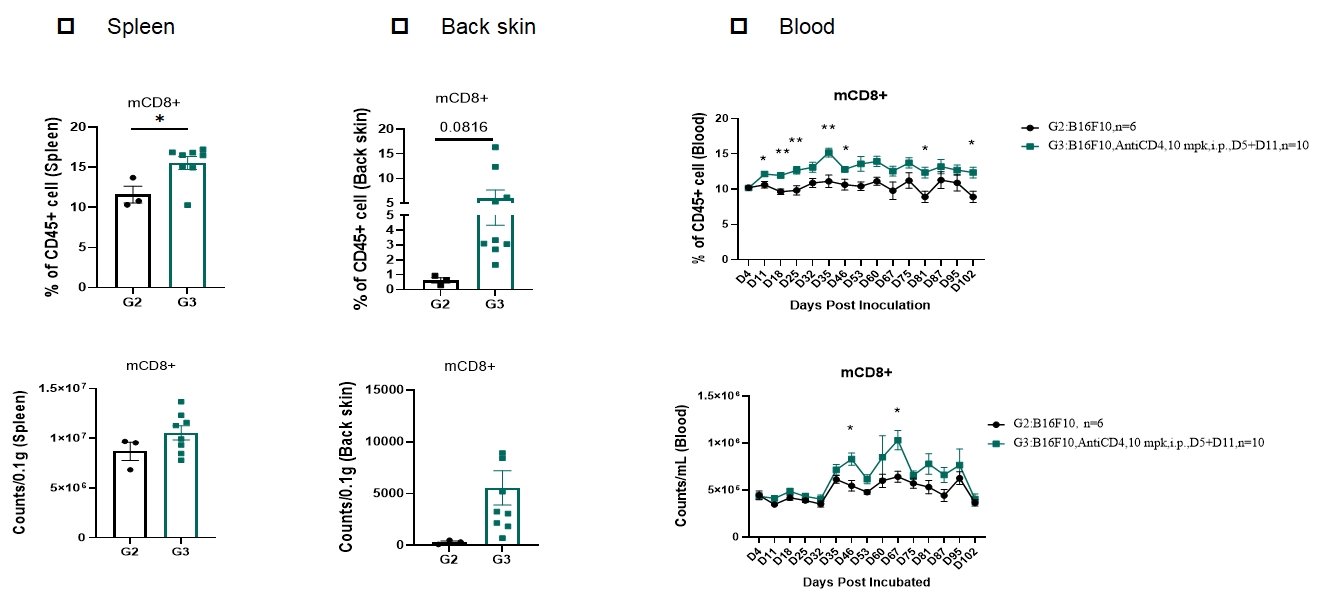
The percentage and number of CD8+ T cell in spleen, back skin and blood increased in G3 induced autoreactive vitiligo group. Data presented as mean±s.d. and analyzed using t-test. Statistical significance is denoted as follows: *p < 0.05, **p < 0.01, and ***p < 0.001.
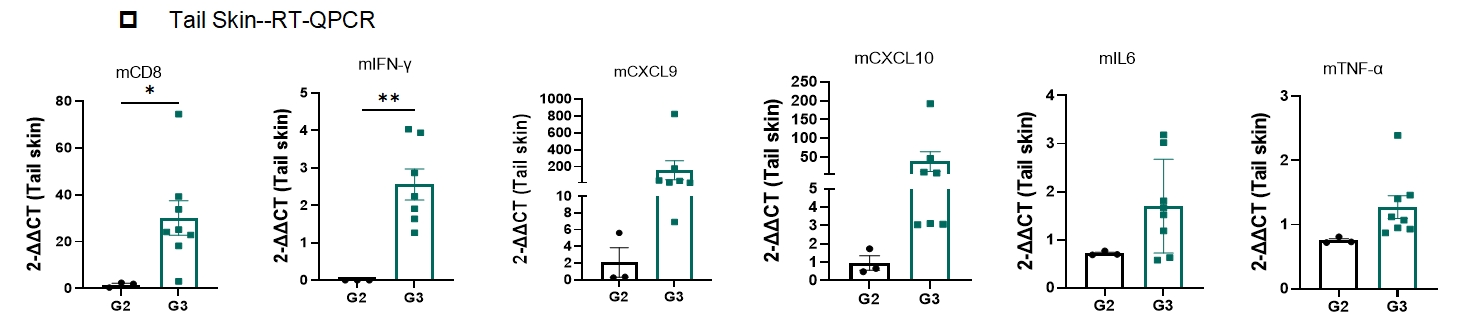
Mouse CD8/CXCL9/CXCL10/IFN-γ transcript levels were increased in G3 induced autoreactive vitiligo group. Data presented as mean±s.d. and analyzed using t-test. Statistical significance is denoted as follows: *p < 0.05, **p < 0.01, and ***p < 0.001.