

60% HFD Induced DIO Rat Models
Obesity is a chronic metabolic disorder characterized by excessive fat accumulation that poses significant risks to health. It arises from a complex interplay of genetic, environmental, behavioral, and hormonal factors, primarily driven by prolonged energy imbalance (caloric intake exceeding expenditure).
Diet-induced obesity in SD rat
The Diet-induced Obesity (DIO) rat model is a widely used preclinical tool for studying obesity, metabolic syndrome, and related comorbidities. By feeding rodents a high-fat or high-calorie diet (typically containing 45–60% fat), this model mimics human obesity development resulting from prolonged excessive energy intake.
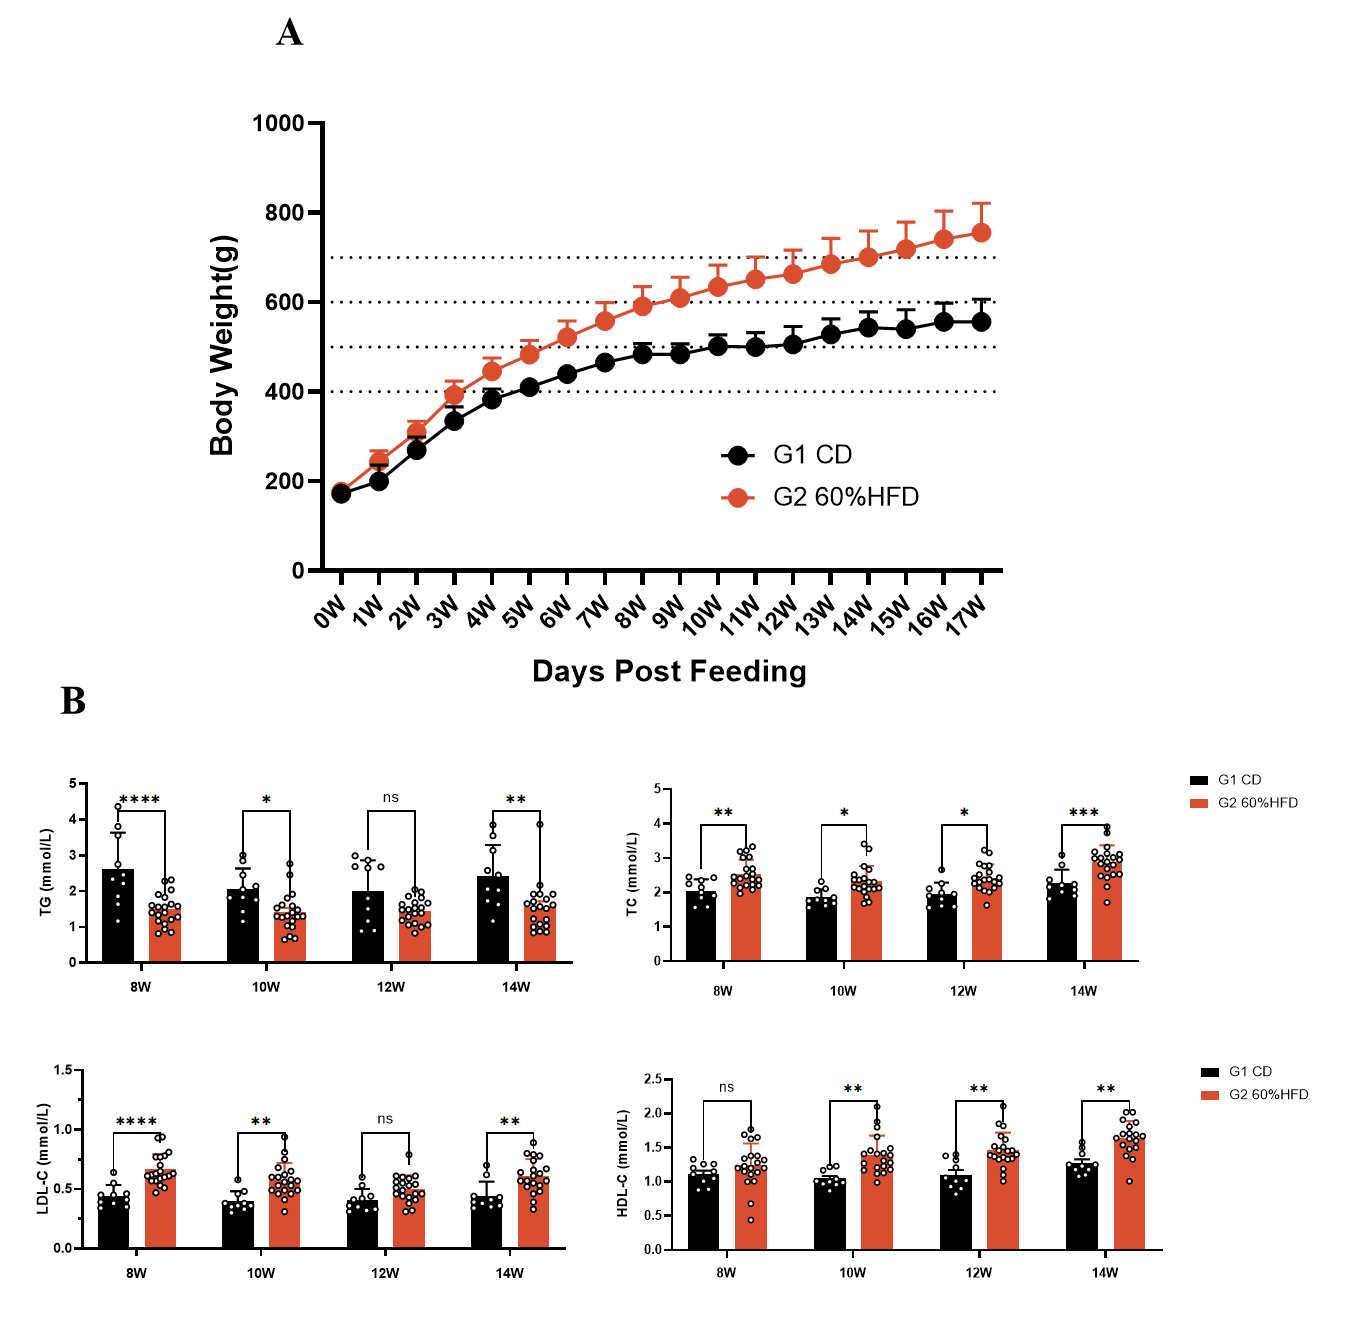
Fig.1 Body weight and serum TC, TG, HDL-C and LDL-C of SD-DIO
Body weight curve of SD-DIO is shown in Fig. 1A. The serum levels of TC, HDL-C, and LDL-C were significantly higher in SD-DIO rats compared to the control group, while the serum TG level is lower (Fig. 1B). Data were presented by mean ± SEM, N=10-60. *, p < 0.05; **, p < 0.01; ***, p < 0.001 and ****, p < 0.0001
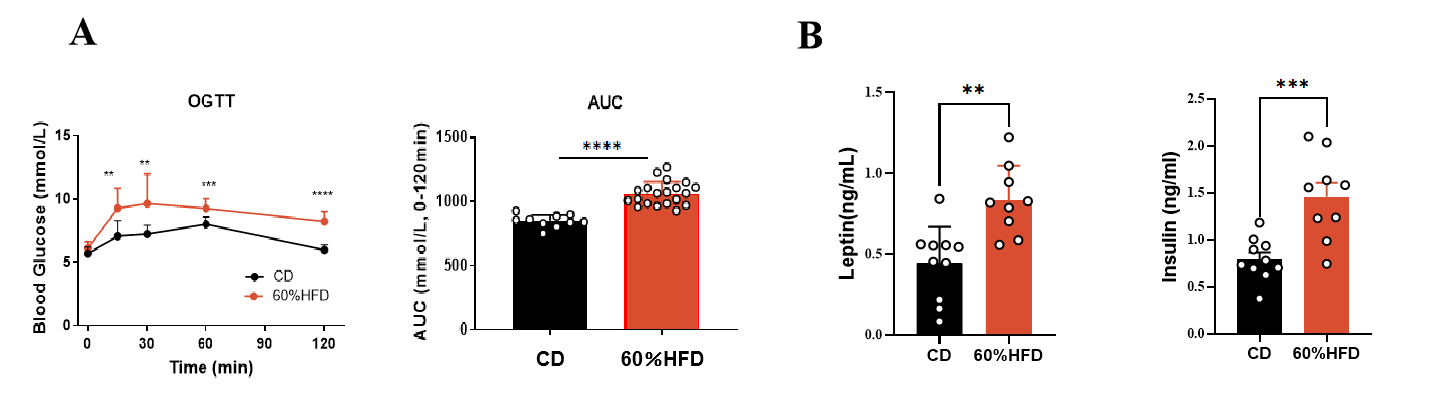
Fig.2 OGTT, serum leptin and insulin of SD-DIO
Following 8 weeks of HFD, SD-DIO rats showed impaired glucose tolerance (Fig. 2A). After 12 weeks of HFD, serum leptin and insulin levels of SD- DIO rat significantly increased compared to standard chow diet (Fig. 2B). Data were presented by mean ± SEM, N=10-20. *, p < 0.05; **, p < 0.01; ***, p < 0.001 and ****, p < 0.0001
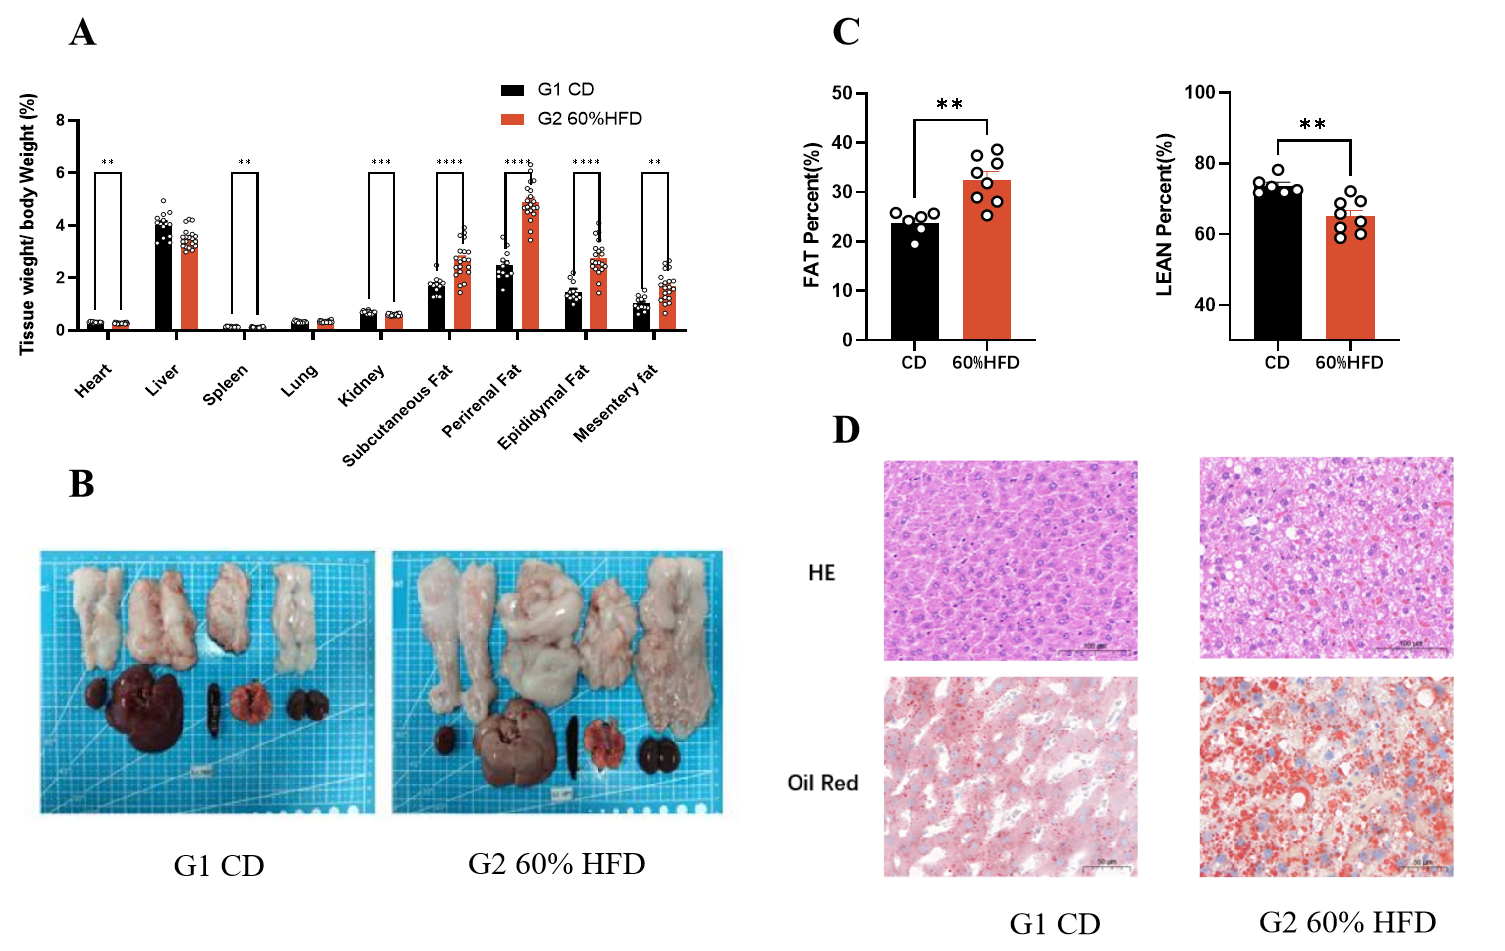
Fig.3 Tissue weight and liver histological observation of SD-DIO
The fat weight of SD-DIO increased significantly after 15 weeks of HFD (Fig.3A-B). Following 12 weeks of HFD, fat weight of SD-DIO increased significantly, while lean mass decreased (Fig.3C, data were collected via Dual-emission X-ray Absorptiometry). Hepatocytes in SD-DIO rats showed significant edema, steatosis, and lipid droplet deposition after 12 weeks of HFD (Fig.3D). Data were presented by mean ± SEM, N=6-20. *, p < 0.05; **, p < 0.01; ***, p < 0.001 and ****, p < 0.0001
Pharmacodynamic evaluation of semaglutide (SEMA) on SD-DIO rat
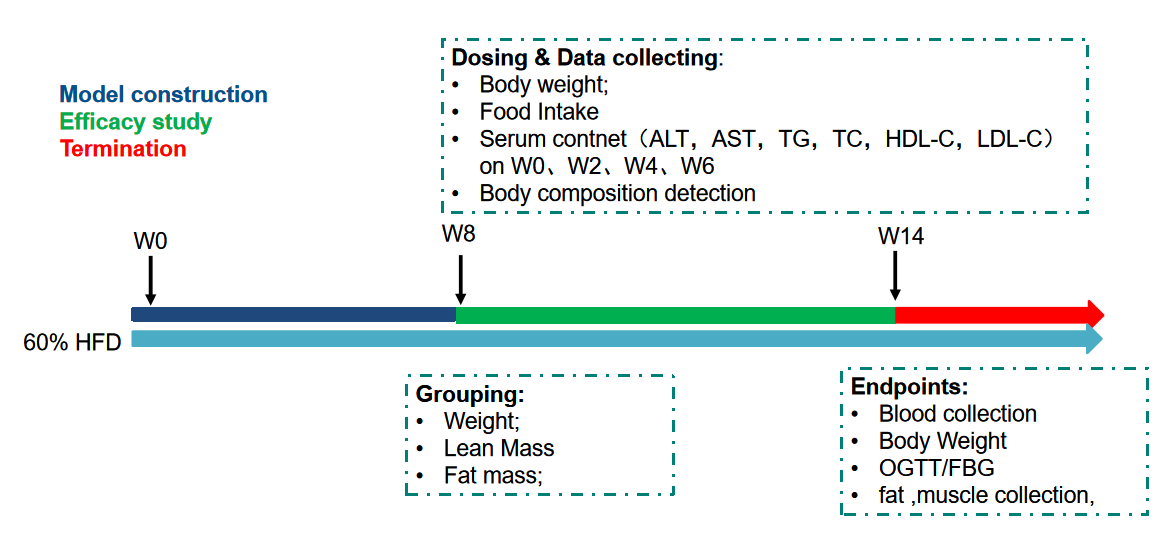
Fig.4 Overview of pharmacodynamic evaluation of SEMA on SD-DIO rat
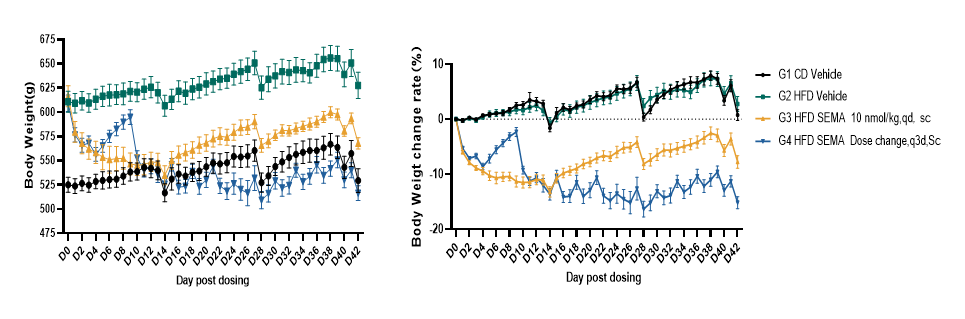
Fig.5 Body weight of SD-DIO decreased after SEMA treatment.
Body weight of SD-DIO decreased after SEMA treatment. Data were presented by mean ± SEM, N=8. *, p < 0.05; **, p < 0.01; ***, p < 0.001 and ****, p < 0.0001
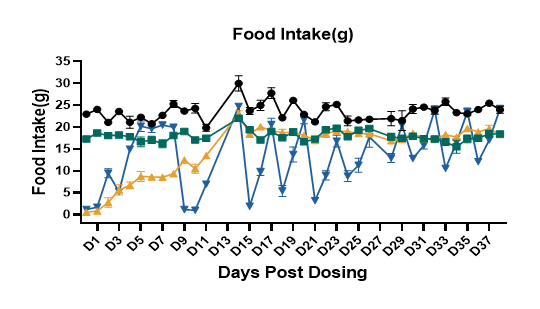
Fig.6 Food intake of SD-DIO decreased after SEMA treatment.
Food intake of SD-DIO decreased after SEMA treatment. Data were presented by mean ± SEM, N=8. *, p < 0.05; **, p < 0.01; ***, p < 0.001 and ****, p < 0.0001
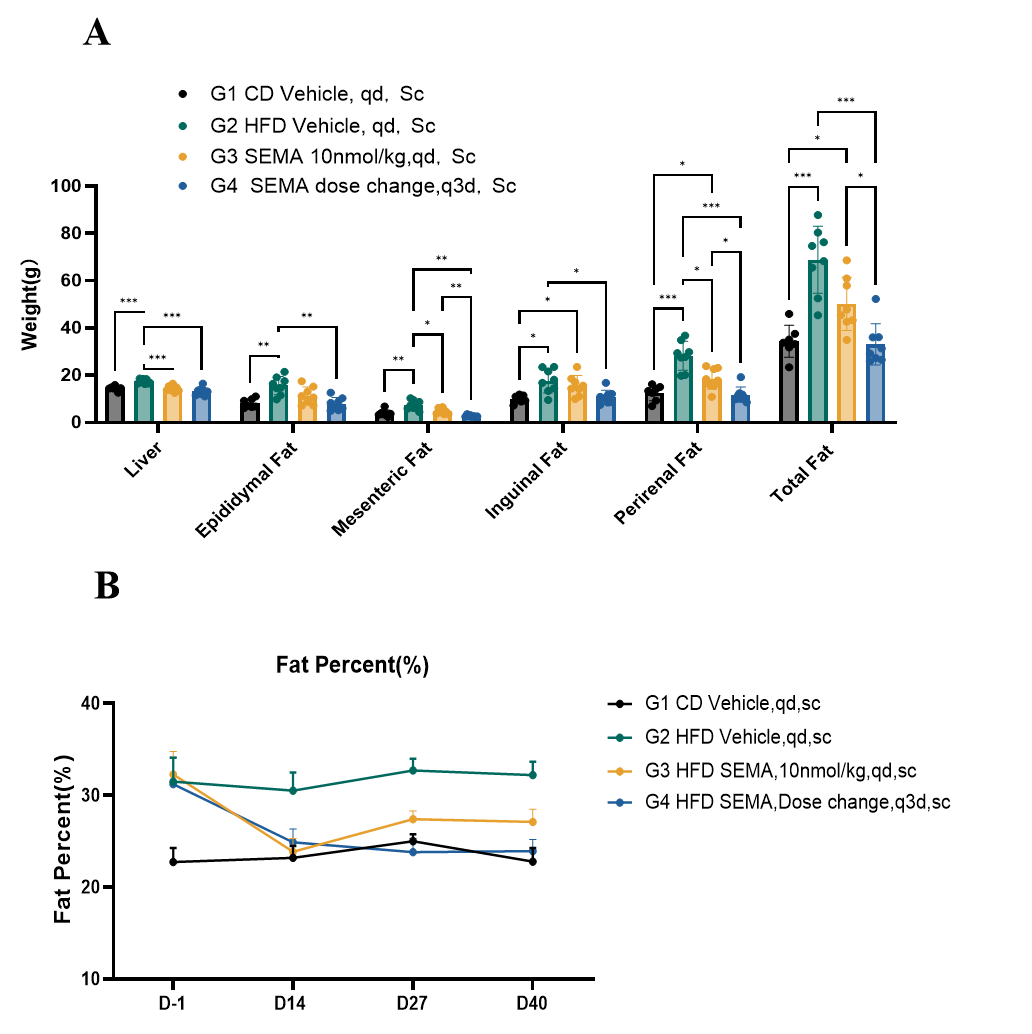
Fig.7 Food intake of SD-DIO decreased after SEMA treatment.
The fat weight of SD-DIO decreased after six-weeks of SEMA administration (Fig.7A). The fat percent of SD-DIO rat decreased after six-week SEMA administration. (Fig.7B, data collected via Dual-emission X-ray Absorptiometry). Data were presented by mean ± SEM, N=8. *, p < 0.05; **, p < 0.01; ***, p < 0.001 and ****, p < 0.0001
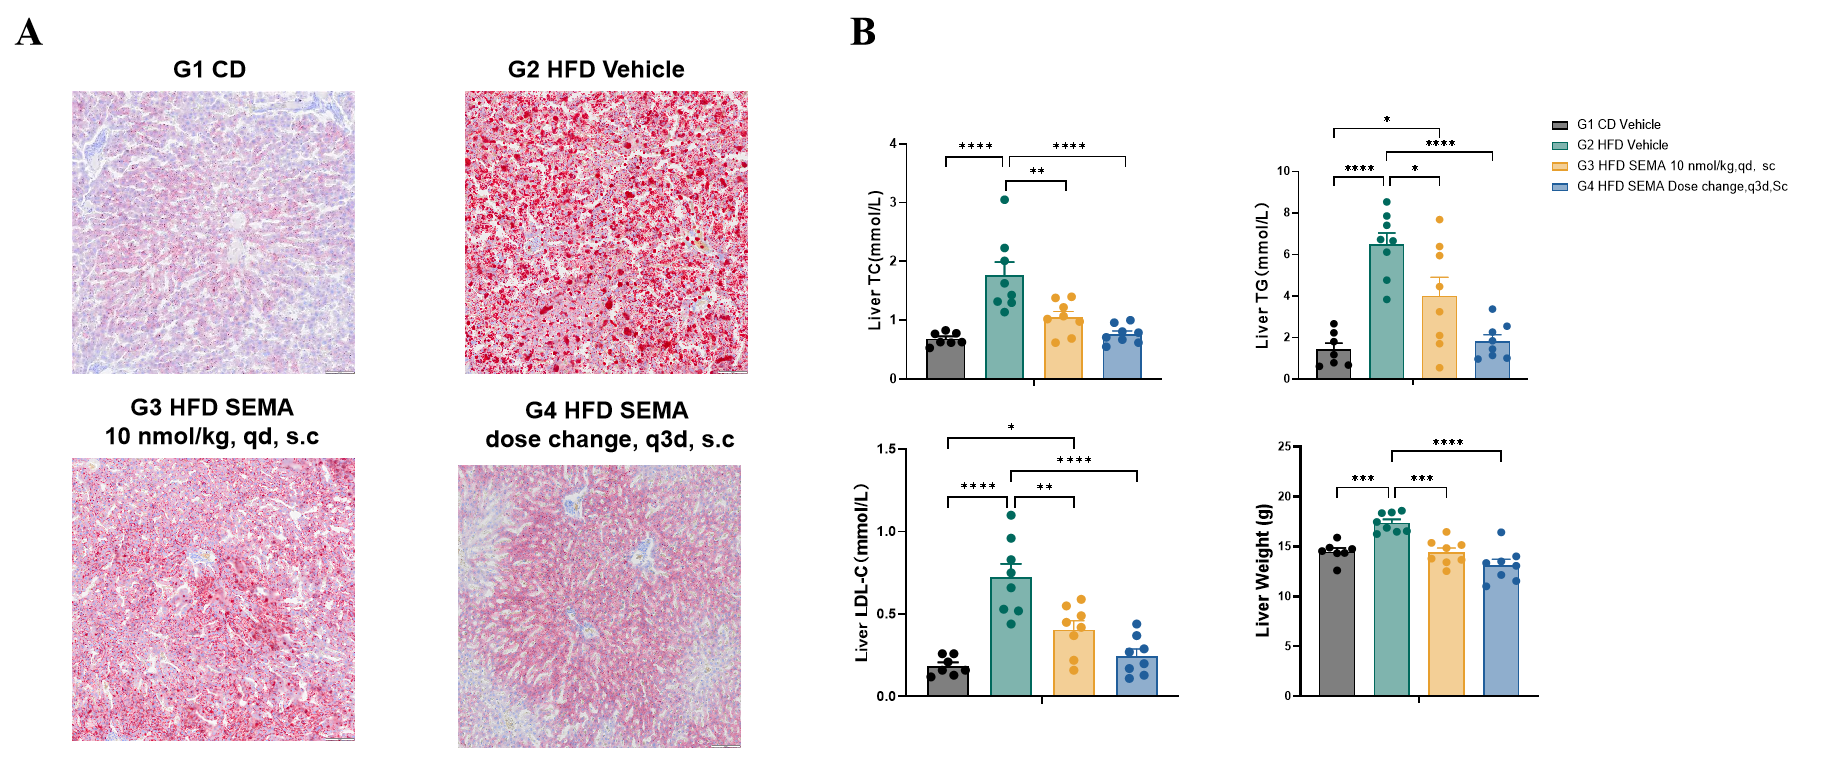
Fig.8 Liver TG, TC, LDL-C and histological observation of SD-DIO after SEMA treatment.
TG, TC and LDL-C content in SD-DIO liver decreased significantly after six weeks of SEMA administration (Fig.8A). Oil red staining showed that the lipid droplet deposition in the liver of DIO rats decreased after six-week SEMA administration (Fig.8B). Data were presented by mean ± SEM, N=8. *, p < 0.05; **, p < 0.01; ***, p < 0.001 and ****, p < 0.0001